Handling Data Group by Case Attributes
Group by Case Attributes splits a chart or analysis into multiple color-coded groups, one per selected attribute value or value range. It is available in the configuration panel of many dashboards and views, and lets you compare how a metric differs across subsets of cases (for example, how throughput time varies by department, or how case volume develops over time for different spending categories).
Once applied, a legend appears alongside the chart matching each color to its group. All chart elements (lines, box plots, bars, etc.) update to reflect the grouping.
Selecting an Attribute
Open the configuration panel and select a case attribute from the Group by Case Attributes dropdown. This opens the grouping dialog, whose contents depend on the attribute's data type.
Text Attributes
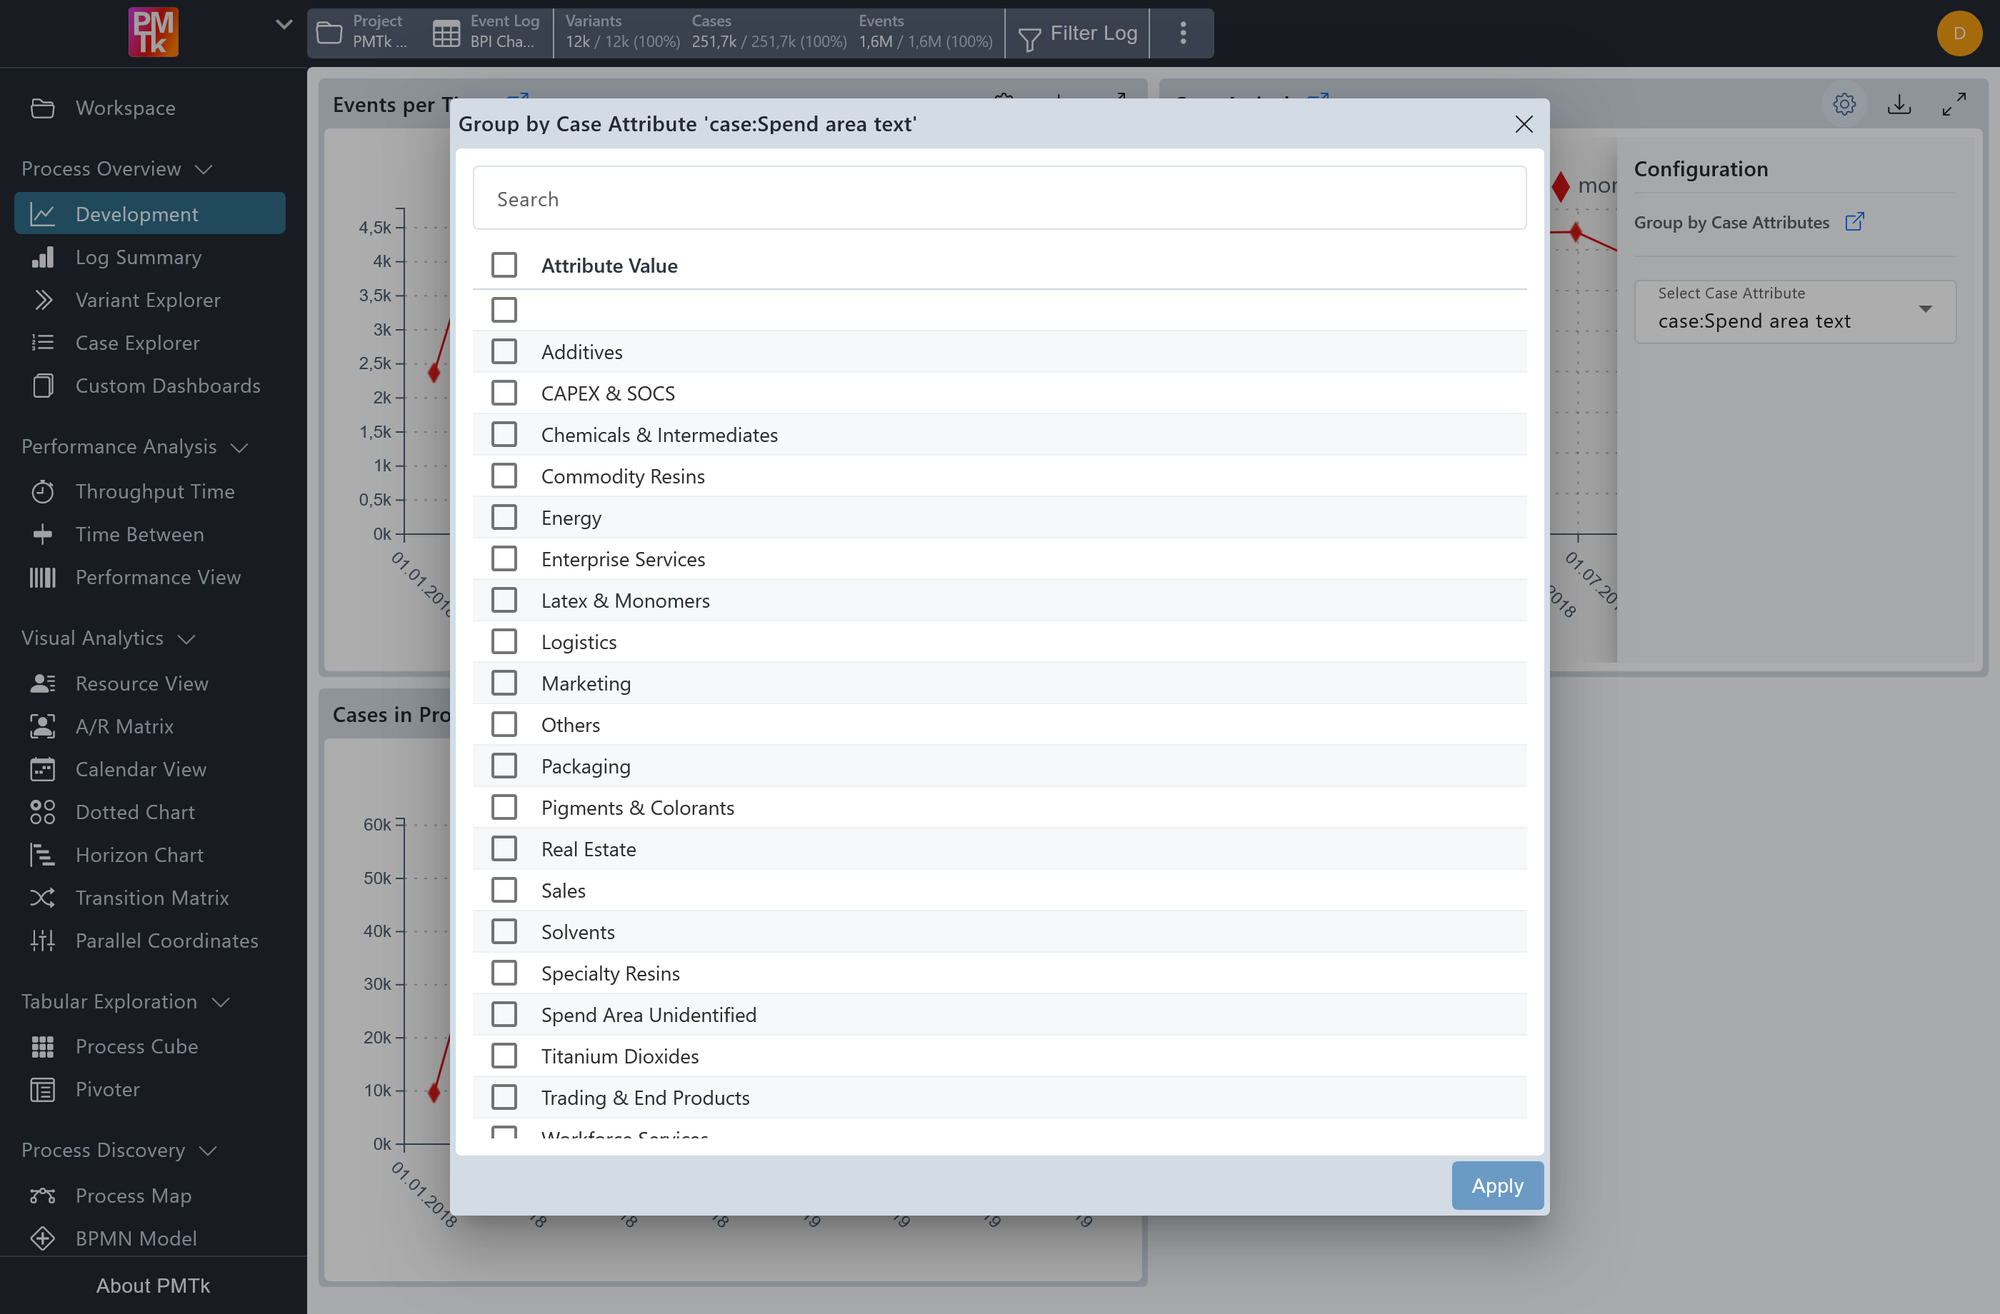
Screenshot shows the Group by Case Attribute dialog for a text attribute (case:Spend area text). Each distinct attribute value is listed with a checkbox for selection. A search field at the top allows filtering the list.
For Text (String) attributes, the dialog lists all distinct values found in the event log. Check the values you want to include as separate groups. A search bar at the top of the list lets you filter values by substring to quickly find the ones you need.
Cases whose attribute value is not among the selected entries are excluded from the grouped view.
Numeric and Date + Time Attributes
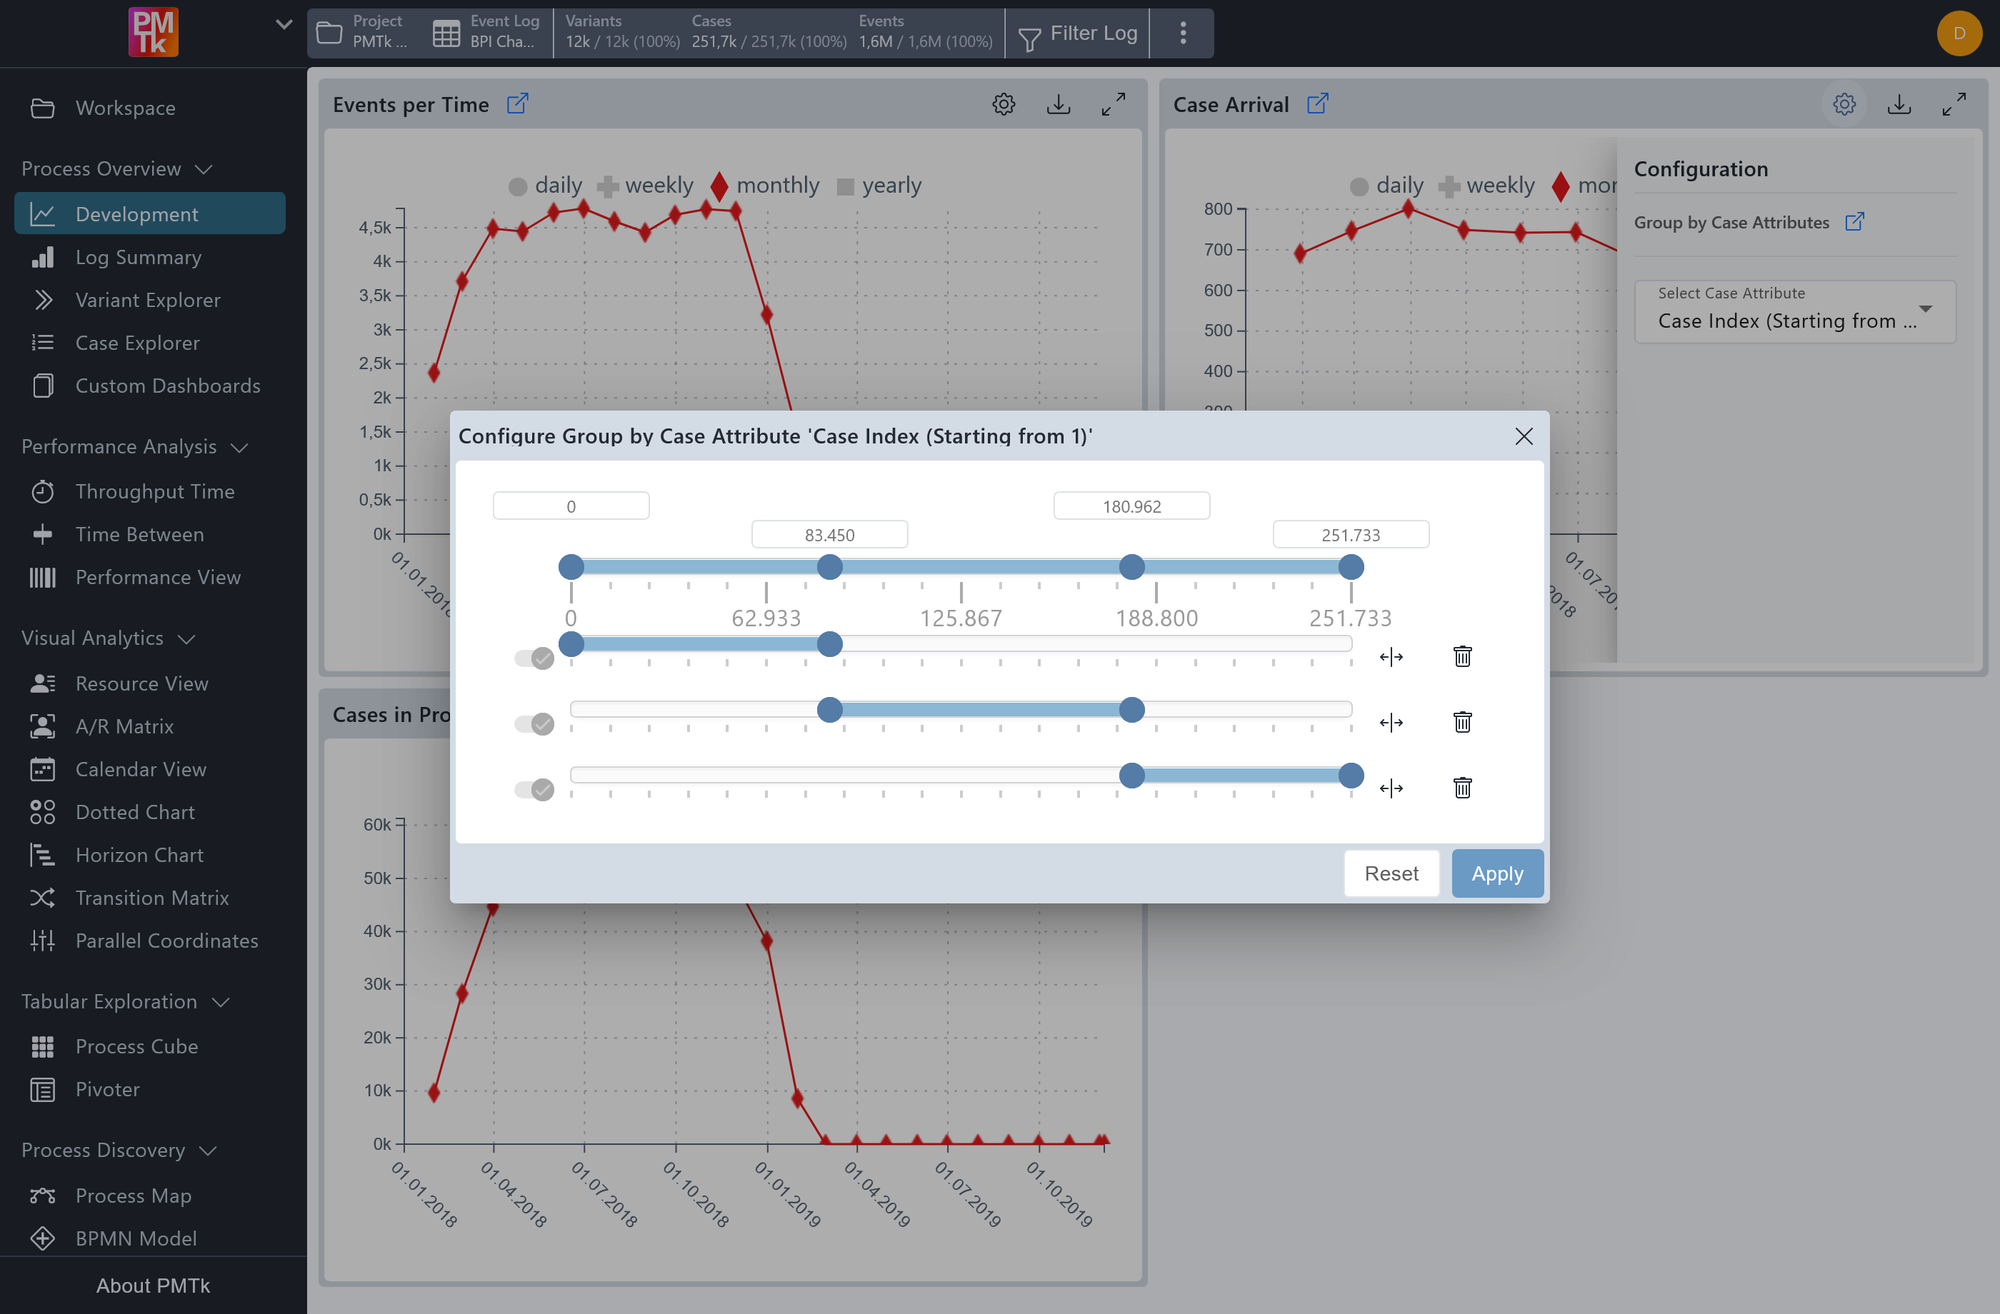
Screenshot shows the Group by Case Attribute dialog for a numeric attribute (Case Index). Three ranges are defined across the full value span. Each range has its boundaries displayed above the slider and can be resized, split, or deleted individually.
For Numeric and Date + Time attributes, the dialog displays the full value span of the attribute divided into a set of contiguous ranges. Each range becomes one group in the chart. The following actions are available per range:
| Action | Description |
|---|---|
| Adjust boundaries | Enter values directly in the boundary fields above the slider, or drag the handles on the slider itself to move the boundaries. |
| Split | Splits the range into two equal halves. Both resulting ranges can then be adjusted independently. |
| Delete | Removes the range. The neighboring ranges automatically expand to fill the vacated space, keeping the full value span covered. |
Applying the Grouping
Click Apply to activate the grouping and update all affected charts. Click Reset to go back to the default ranges set by PMTk. Click close to dismiss the dialog without making changes.
