Visual Analytics A/R Matrix
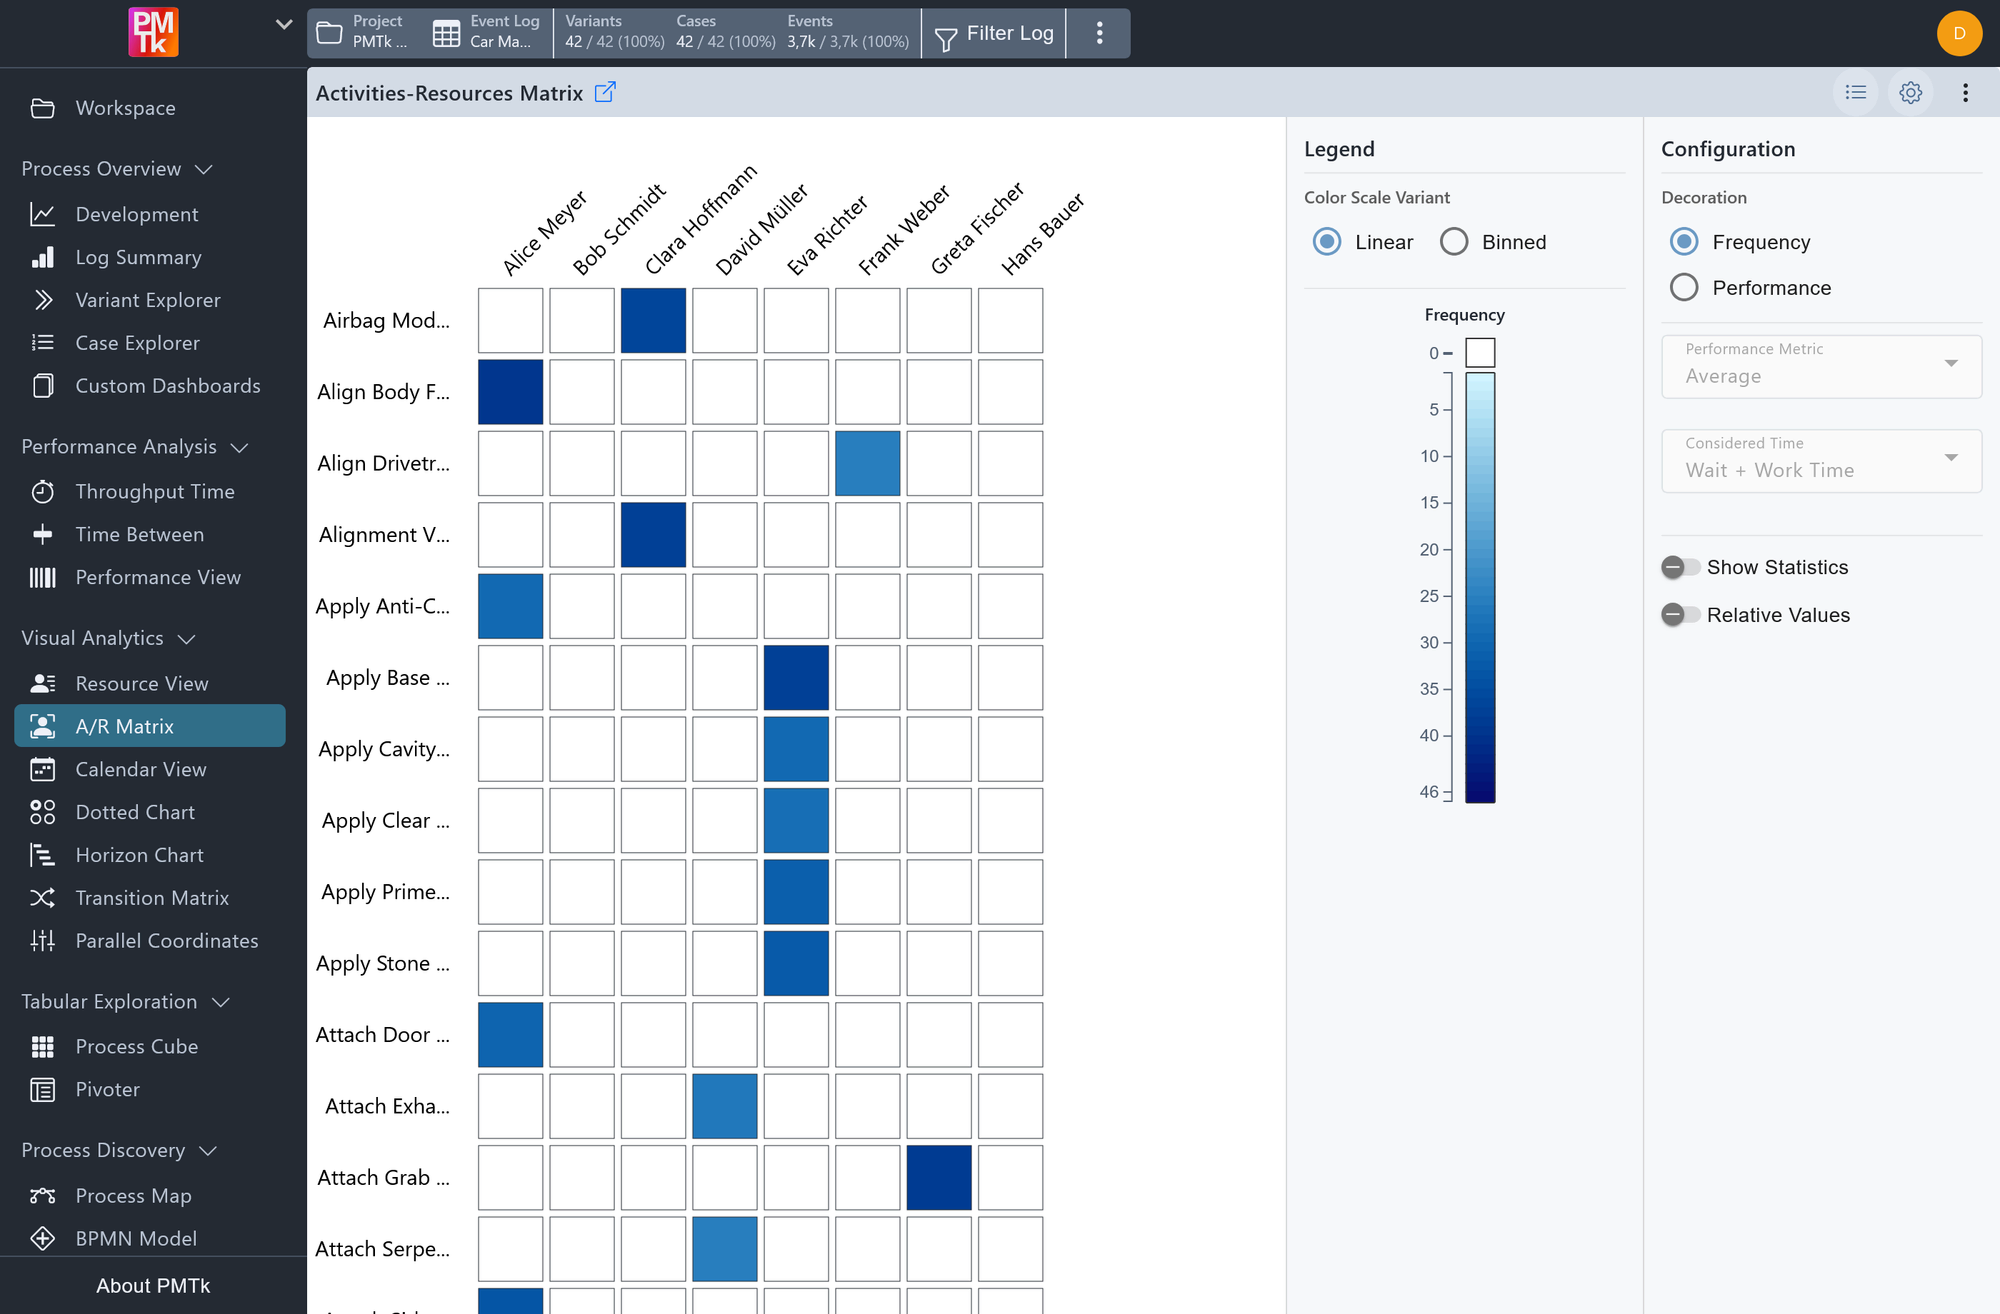
Screenshot shows the Activities-Resource Matrix visualizing how frequently each resource performed each activity in the process. The darker the cell color, the higher the number of recorded occurrences for that activity-resource combination.
The Activity-Resource Matrix provides a cross-tabular heatmap that maps activities (rows) against resources (columns), making it easy to understand how work is distributed across your team or system. Each cell represents the relationship between a specific activity and a specific resource, colored by intensity to reflect either how frequently that resource performed the activity, or how well they performed it in terms of time. Empty (uncolored) cells indicate that a given resource was not involved in that activity within the filtered event log.
This view is particularly useful for identifying specialization patterns, workload imbalances, or performance bottlenecks at the activity-resource level.
A/R Matrix Configuration
The legend panel and configuration panel provide the following settings.
| Setting | Description | Values |
|---|---|---|
| Color Scale Variant | Controls how metric values are mapped to colors. |
|
| Show Statistics | Toggles the display of statistical information within the matrix cells. |
|
| Relative Values | Toggles the use of relative values compared to the total occurrence in each row. |
|
| Decoration | Controls what the cell values represent. |
|
| Performance Metric | Determines how the time values are aggregated per cell. Requires Decoration: Performance. |
|
| Considered Time | Specifies which portion of time is measured. Requires Decoration: Performance. |
|
A/R Matrix Filtering
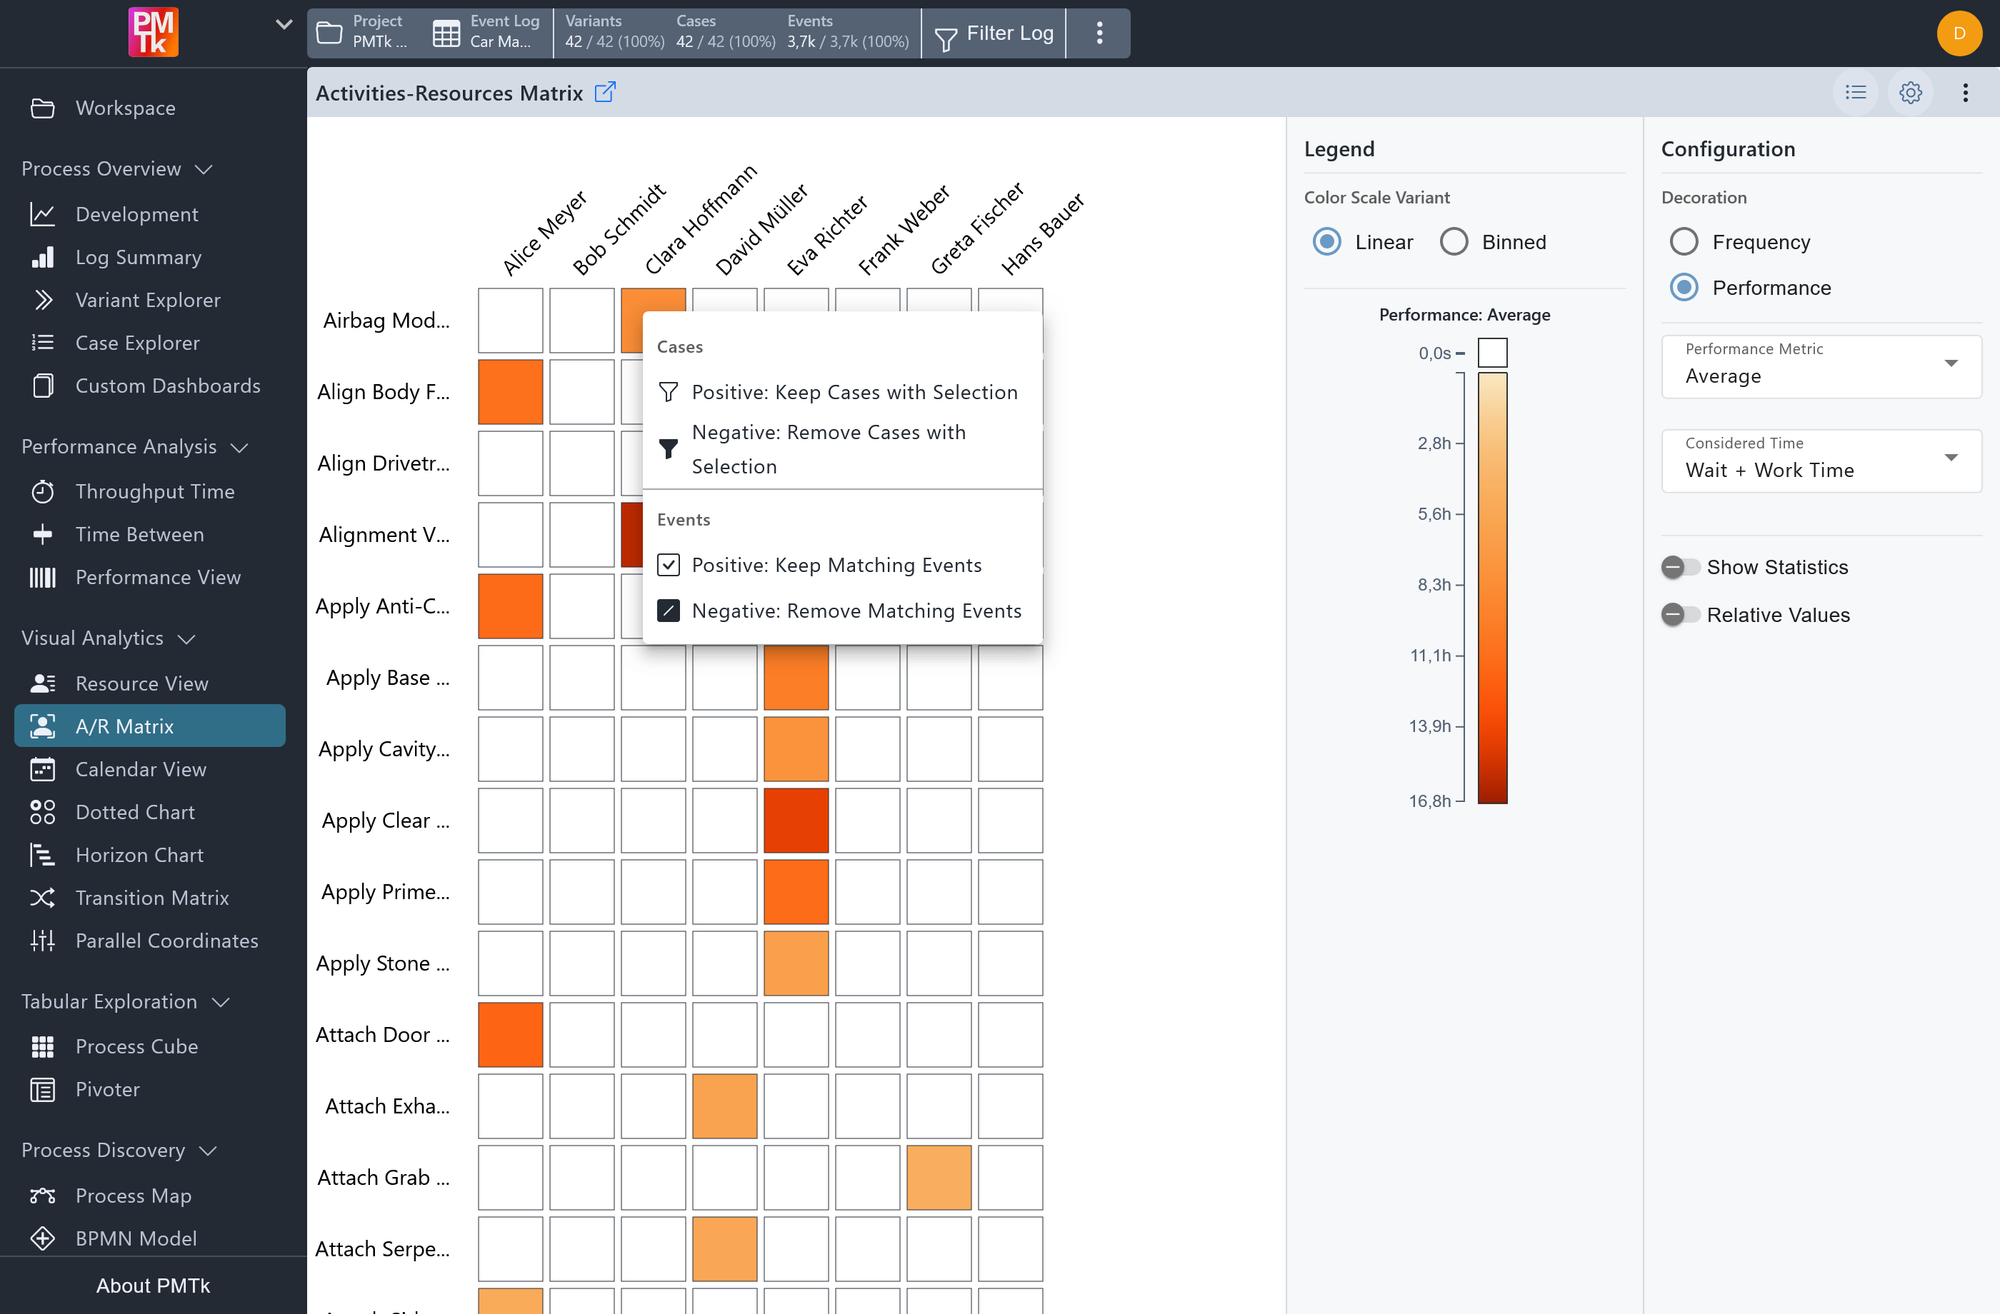
The image shows the filter mode selection in the activity-resource matrix.
Clicking on any cell in the matrix opens a context menu that allows you to apply an Activity-Resource Filter scoped to that specific activity-resource combination. The following filter modes are available:
| Option | Effect |
|---|---|
| Cases | |
| Positive: Keep Cases with Selection | Retains only cases that include at least one event where the selected resource performed the selected activity. |
| Negative: Remove Cases with Selection | Retains only cases that do not contain any event where the selected resource performed the selected activity. |
| Events | |
| Positive: Keep Matching Events | Keeps only the individual events matching the activity-resource combination, removing all other events from the log. |
| Negative: Remove Matching Events | Removes all individual events matching the activity-resource combination, leaving the rest of the log intact. |
The filter is applied globally, restricting all downstream analyses and views. It is consistent with the Activity-Resource Filter applied elsewhere in PMTk and can be cleared or adjusted at any time through the filter controls in the top bar.
