Process Discovery BPMN Model
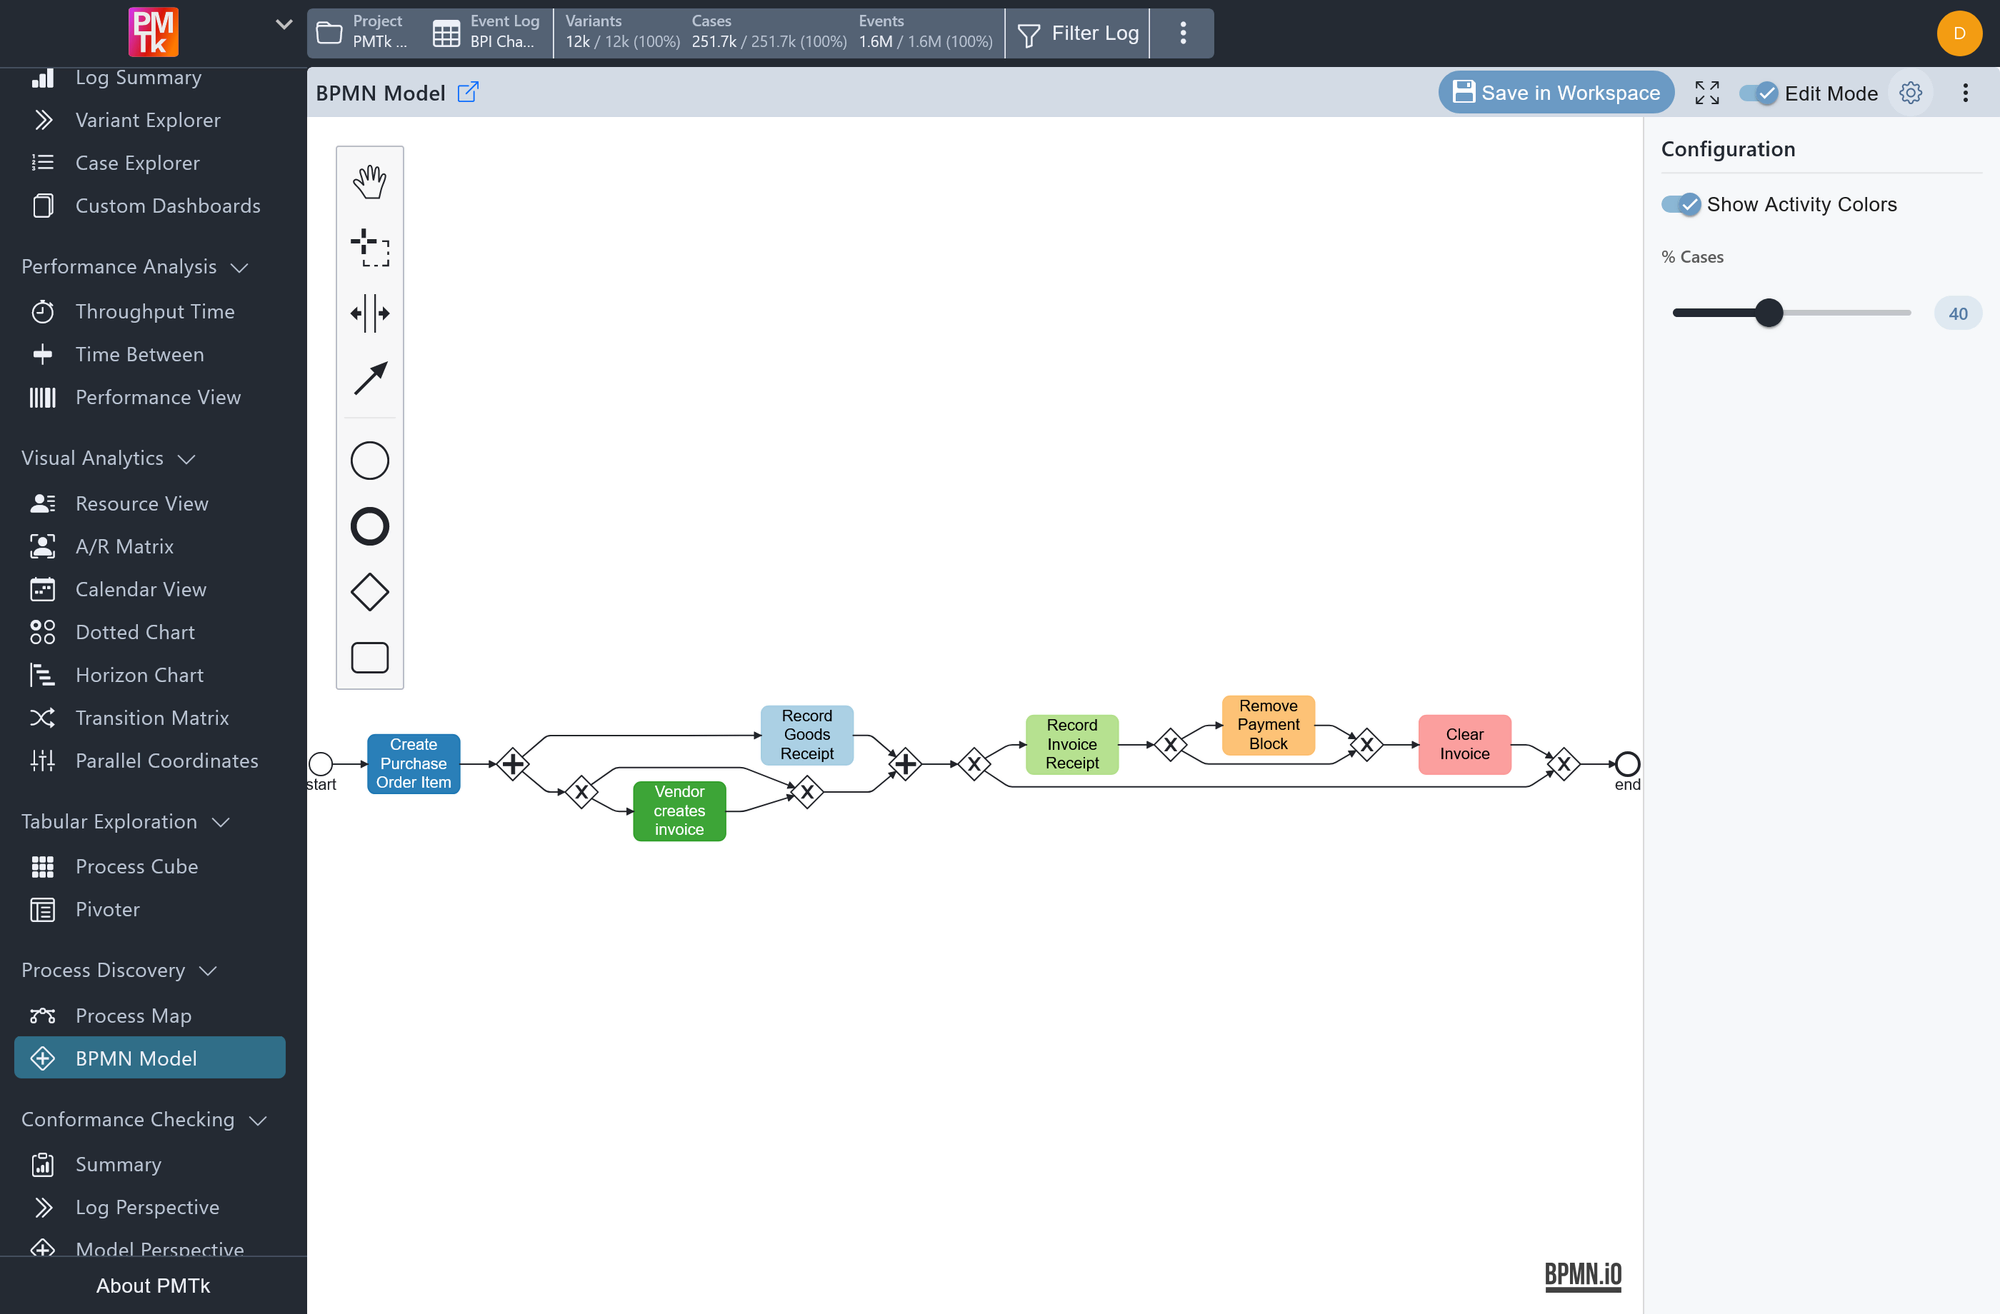
Screenshot shows the BPMN Model view displaying a BPMN model discovered using the Inductive Miner algorithm. Edit mode is active, with the BPMN editing toolbar visible on the left. The model covers 40% of cases and shows activity colors enabled. The diagram is rendered using the BPMN.io library.
The BPMN Model view automatically generates a BPMN model (Business Process Model and Notation) from the event log using the Inductive Miner algorithm. The resulting model represents the discovered process structure as a standardized flowchart of activities, gateways, and control-flow elements, making it suitable for both analysis and communication with stakeholders.
The generated model can be saved to the workspace via Save in Workspace in the toolbar, after which it becomes available for further analysis in the Conformance Checking section.
BPMN Model Toolbar
The toolbar above the model provides controls for navigating and interacting with the plot. Besides the standard controls found in all dashboards (like configuration toggle or chart download in ), the exclusive ones from left to right are:
| Option | Effect |
|---|---|
| Save in Workspace | Saves the current BPMN model to the workspace, making it available for conformance checking. |
| Autoscale | Resets the zoom and pan to fit the entire model within the visible area. |
| Edit Mode | Switches between view mode and edit mode. In edit mode, the BPMN editing tools become available for manual adjustments (see below). |
BPMN Model Configuration
The configuration panel provides the following options.
| Setting | Description | Values |
|---|---|---|
| Show Activity Colors | When enabled, activity nodes in the BPMN model are colored by activity type, consistent with the color scheme used across other components. |
|
| % Cases | A slider controlling what percentage of cases the discovered model must cover. Higher values produce more inclusive models that accommodate more of the process variants but may be more complex; lower values produce simpler models that focus on the most common process paths. |
|
BPMN Model Node Interactions
Outside of edit mode, clicking on any activity node opens a context menu with the following options:
| Option | Effect |
|---|---|
| Open Activity Dashboard | Opens the Activity Dashboard for detailed statistics on that activity. |
| Filter cases containing | Retains only cases that include at least one occurrence of this activity. |
| Filter cases not containing | Removes all cases that include this activity. |
| Filter cases with rework | Retains only cases where this activity occurs more than once. |
| Filter cases starting with | Retains only cases whose first activity is this one. |
| Filter cases ending with | Retains only cases whose last activity is this one. |
| Crop log from activity | Crops all cases to begin at this activity. |
| Crop log to activity | Crops all cases to end at this activity. |
See the Activity Dashboard section in the Process Map documentation for details on the dashboard popup.
BPMN Model Edit Mode
When edit mode is enabled, a toolbar of BPMN editing tools appears on the left side of the canvas, allowing you to manually adjust the discovered model. The available tools are:
| Tool | Description |
|---|---|
 Hand Tool Hand Tool | Pan around the canvas by clicking and dragging. |
 Lasso Tool Lasso Tool | Draw a selection rectangle to select multiple elements at once. |
 Create/Remove Space Tool Create/Remove Space Tool | Add or remove space between elements on the canvas to adjust the layout. |
 Global Connect Tool Global Connect Tool | Draw a connection between any two elements in the model. |
 Start Event Start Event | Place a new start event on the canvas. |
 End Event End Event | Place a new end event on the canvas. |
 Gateway Gateway | Place a new gateway on the canvas. After placing, select the gateway and use  to switch between an AND gateway to switch between an AND gateway  and an OR gateway and an OR gateway  . . |
 Task Task | Place a new task on the canvas. When naming a task, enter the activity name exactly as it appears in the event log for correct mapping during conformance checking. The task will automatically inherit the color of the corresponding activity in the log if activity colors are enabled. |
