Data Filtering Cycle Time
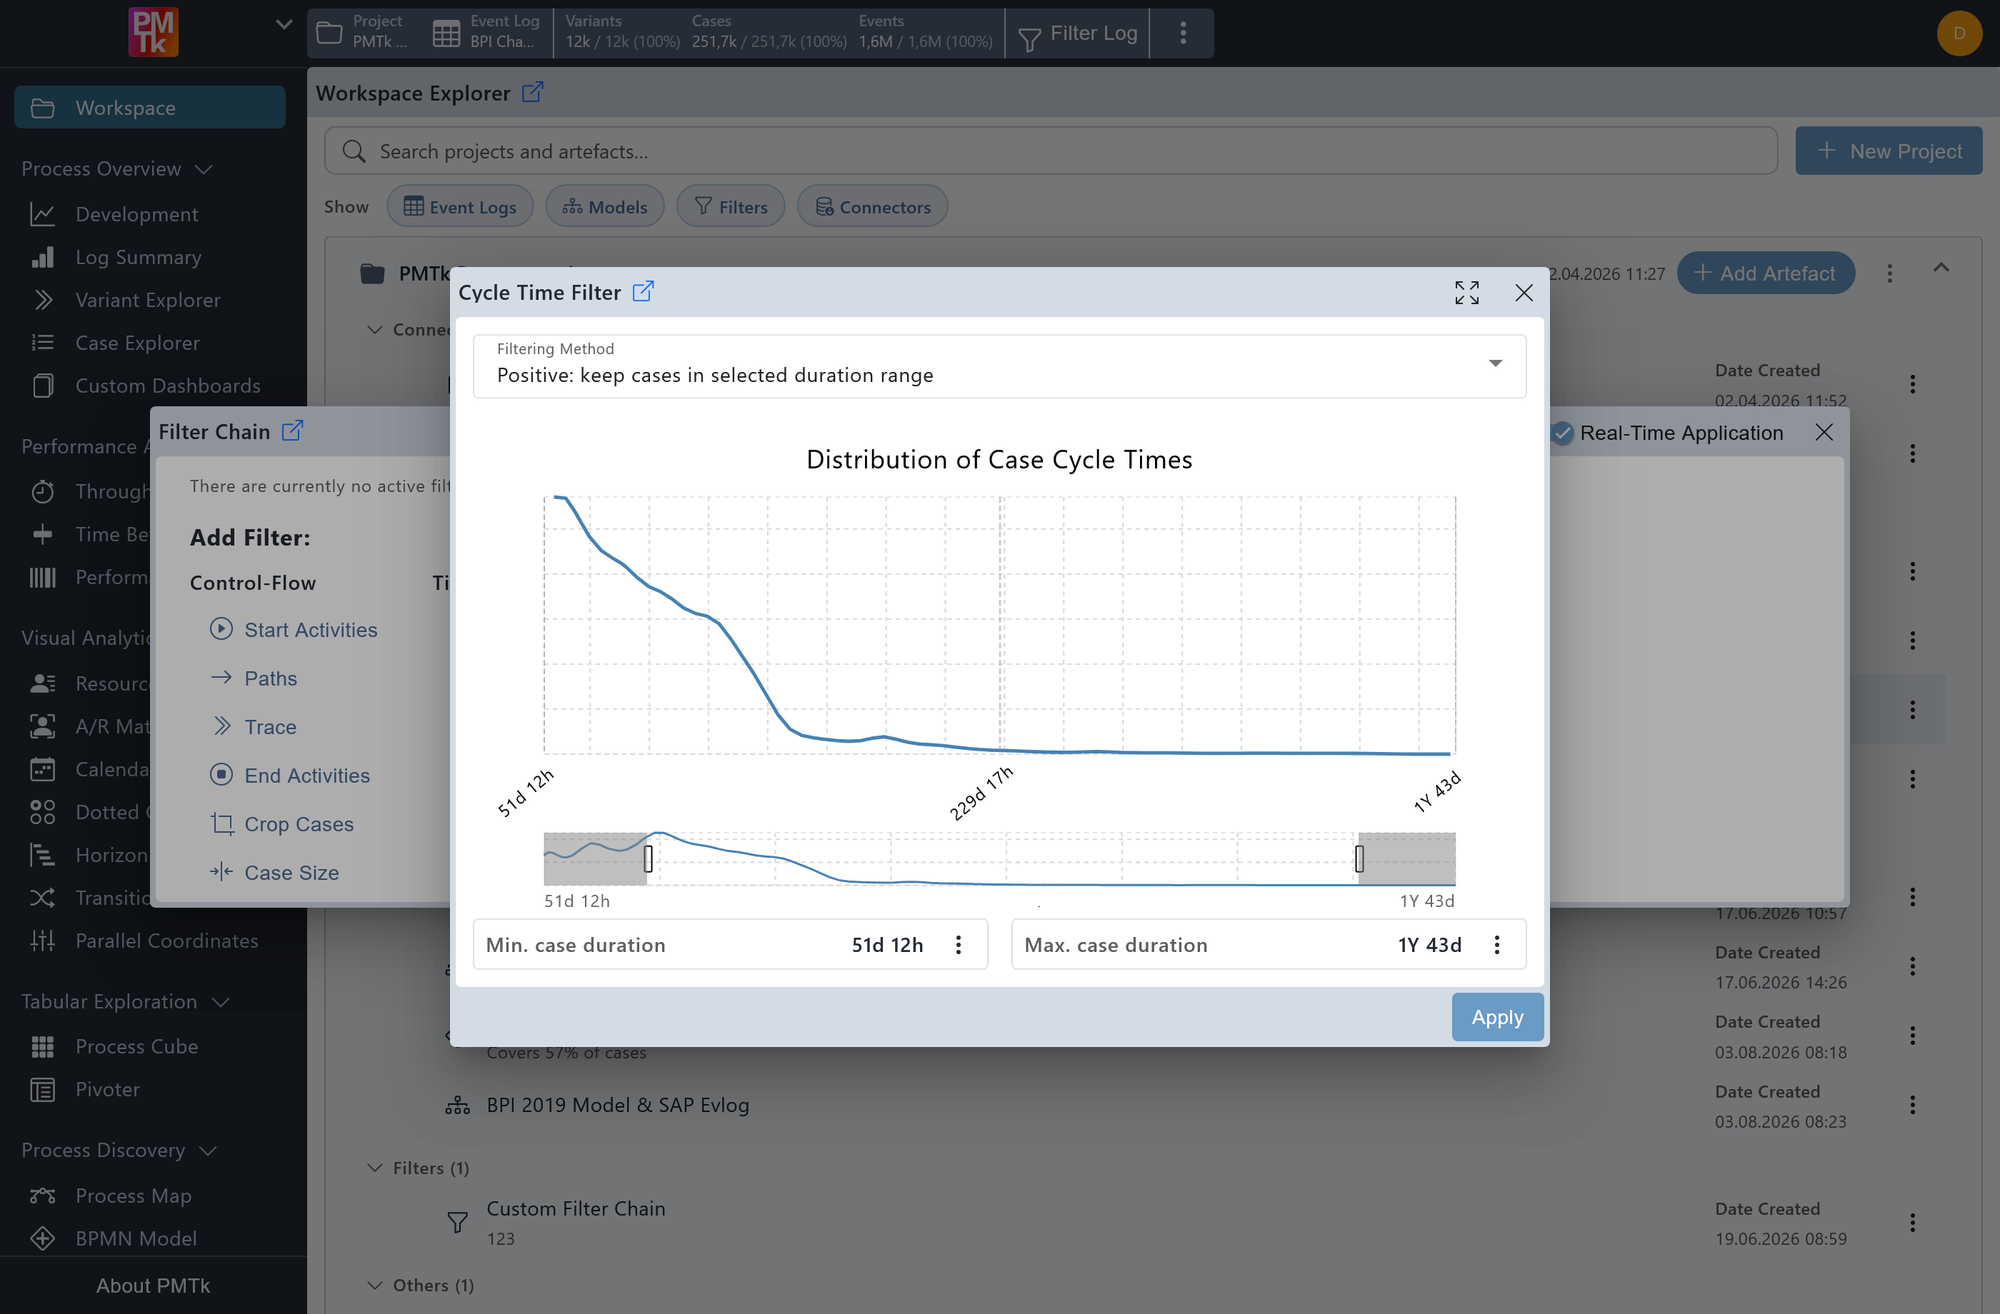
Screenshot shows the Cycle Time Filter dialog with the filtering method set to Positive: keep cases in selected duration range. The distribution chart displays the spread of case cycle times across the log. The selected range spans from 1 month 3 weeks 6 days to 1 year 1 month 1 week, with the min and max duration values shown below the range slider.
The Cycle Time Filter allows you to restrict the event log to cases whose total duration falls within a specified range. A distribution chart provides a visual overview of how case durations are spread across the log, making it easy to identify natural thresholds for filtering.
Filtering Method
Controls how the selected duration range is applied:
- Positive: keep cases in selected duration range: Retains only cases whose total duration falls within the selected range.
- Negative: remove cases in selected duration range: Removes all cases whose total duration falls within the selected range.
Selecting the Range
The minimum and maximum case duration bounds can be defined in two ways:
- Distribution chart: Click and drag directly on the chart or drag the handles on the range slider below the chart to mark a range. The current min and max values are displayed beneath the slider. Double-clicking the chart or clicking in the top-right corner resets the selection to the full range.
- Manual input: Clicking button next to either the minimum or maximum duration field opens a dedicated input dialog where the duration can be specified in Days, Hours, Minutes, and Seconds.
Cases whose total duration falls between the specified minimum and maximum (inclusive) are retained or removed depending on the selected Filtering Method.
On applying the filter, a corresponding entry is appended to the Filter Chain. Existing filters can be reviewed, reordered, and removed in the Filter Chain.
