Handling Data Filter Log
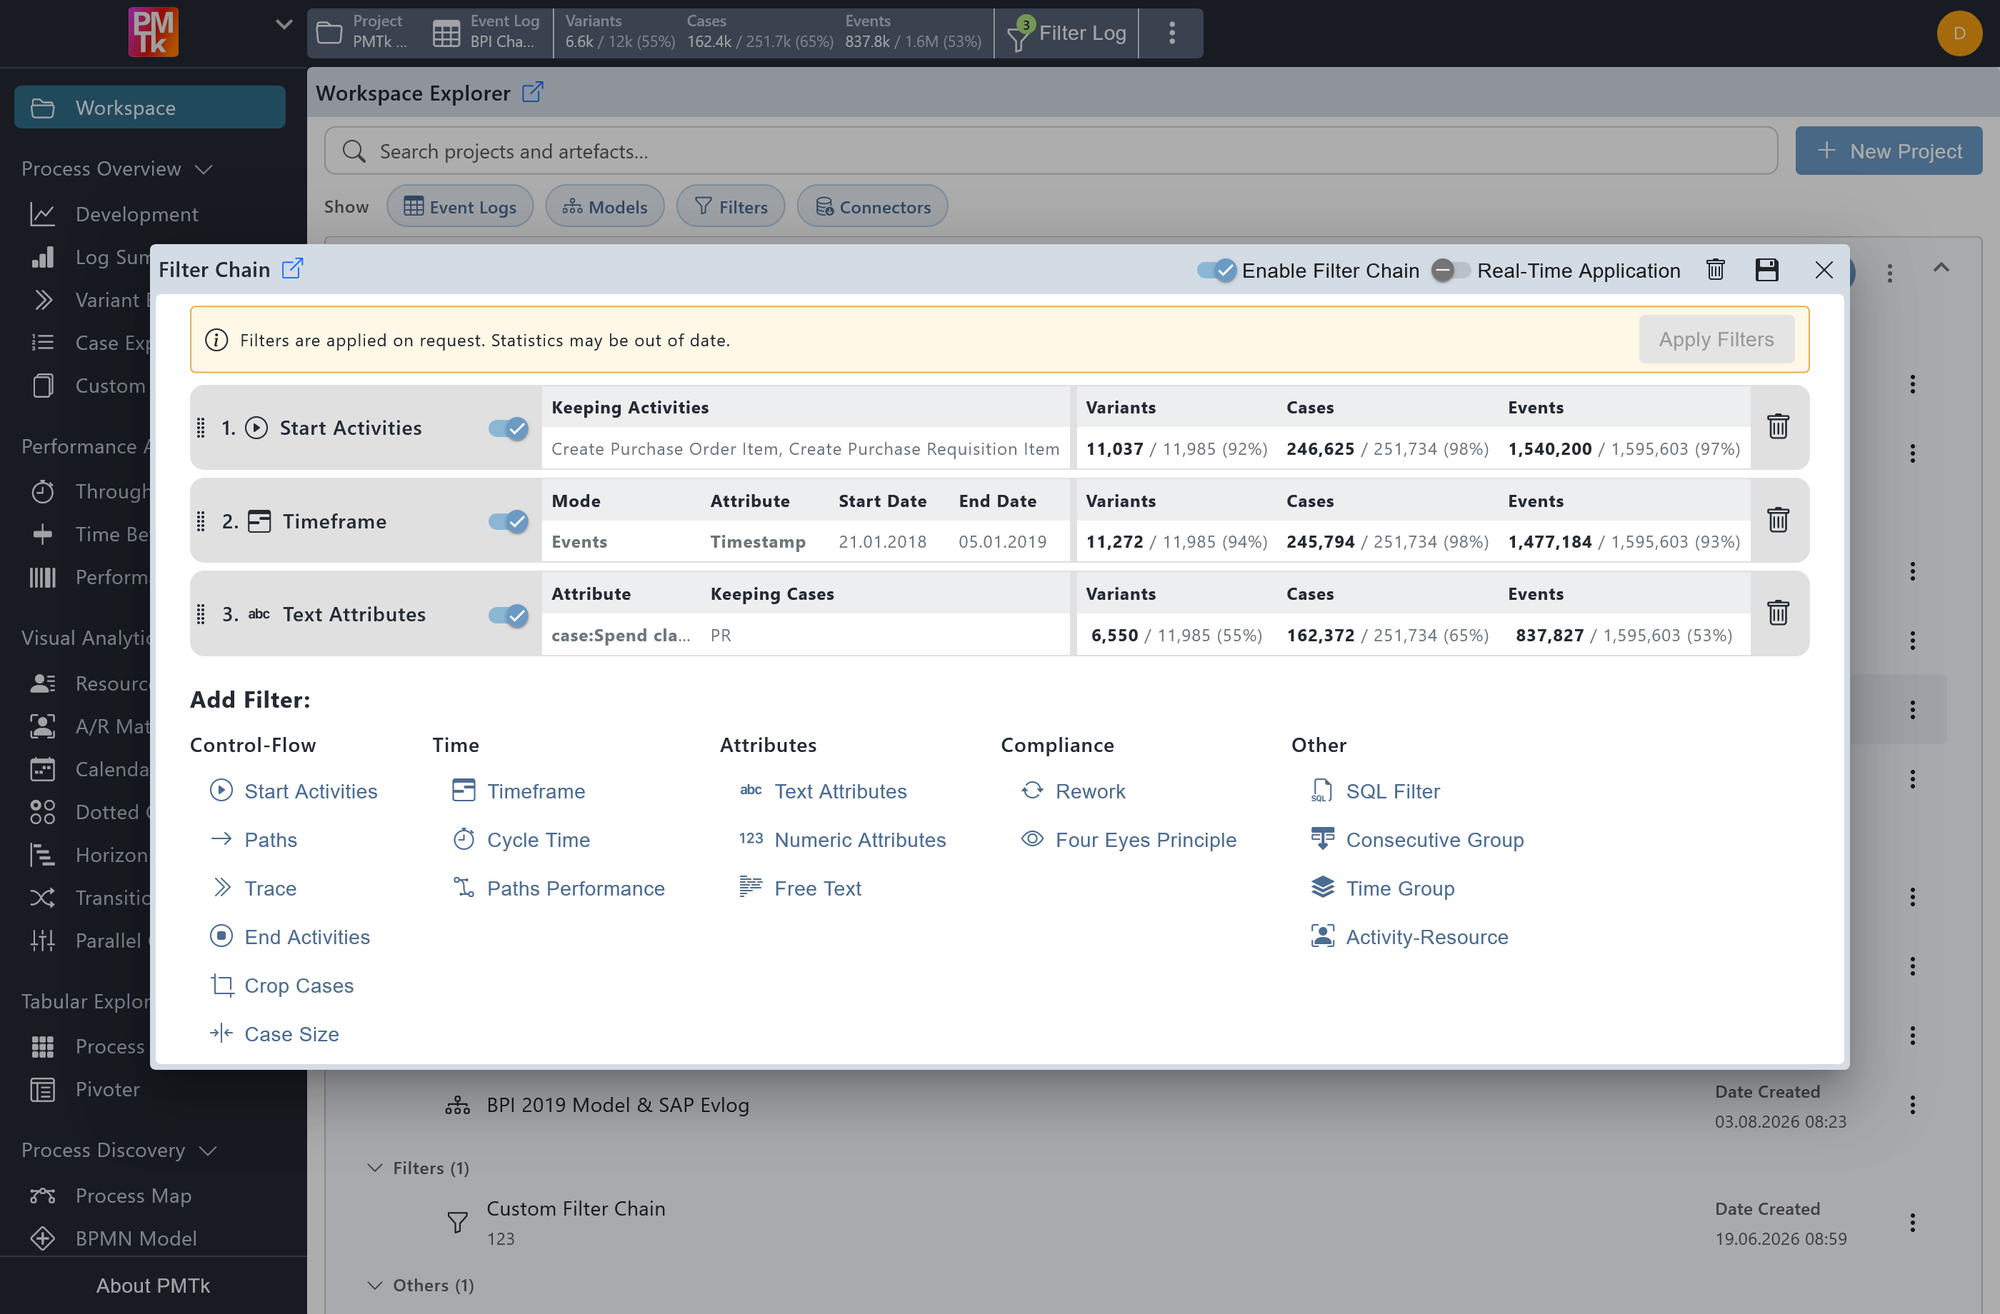
Screenshot shows the Filter Log dialog with three active filters applied in sequence: a Start Activities filter, a Timeframe filter, and a Text Attributes filter. Each filter displays its configuration summary alongside the resulting Variants, Cases, and Events counts relative to the unfiltered log.
The Filter Log is the central place for managing the active filter chain applied to the loaded event log. It displays all currently active filters in the order they are applied, and provides controls for adding, editing, reordering, enabling, and removing them. All analyses and views in PMTk are based on the filtered event log produced by this chain.
The Filter Log can be opened by clicking Filter Log in the event log control bar at the top.
Which filter types are available, and their default settings, can be configured in Feature Management.
Filter Chain
The filter chain lists all active filters in the order they are applied. Filters are applied sequentially from top to bottom (i.e., each filter receives the output of the one above it as its input). Each filter entry shows a summary of its configuration and the cumulative impact on the event log expressed as Variants, Cases, and Events counts (filtered count / total count, percentage).
The following actions are available per filter entry:
| Action | Description |
|---|---|
| Reorder | Drag the handle on the left side of a filter entry to reorder it within the chain. The statistics of all affected filters update accordingly. |
| Enable / Disable | Use the toggle on the right side of the filter name to enable or disable an individual filter without removing it from the chain. Disabled filters are skipped during application. |
| Edit | Clicking on an enabled filter entry opens the corresponding filter dialog, allowing you to adjust the filter's configuration. The change takes effect immediately (or after clicking Apply filters, depending on the Real-time application setting). |
| Remove | Click the trash icon on the right side of a filter entry to permanently remove it from the chain. |
Filter Log Toolbar
The toolbar at the top of the Filter Log provides the following controls:
| Control | Description |
|---|---|
| Enable filter chain | Activates or deactivates the entire filter chain at once. When disabled, the event log is used in its unfiltered state across all views. Individual filter entries and their configuration are preserved. |
| Real-time application | When enabled, any change to the filter chain (adding, editing, reordering, or toggling a filter) is applied immediately. When disabled, changes are staged and only applied when you click Apply filters, which appears as a banner below the toolbar. |
| Remove All Filters | Removes all filters from the chain at once. |
| Save | Opens a menu with two options:
|
Adding Filters
The Add Filter section at the bottom of the dialog lists all available filter types, grouped by category. Clicking a filter type opens the corresponding filter dialog, where you configure the filter before it is appended to the end of the chain.
| Category | Filters |
|---|---|
| Control-Flow | Start Activities, Paths, Trace, End Activities, Crop, Case Size |
| Time | Timeframe, Cycle Time, Paths Performance |
| Attributes | Text Attributes, Numeric Attributes, Free Text |
| Compliance | Rework, Four Eyes Principle |
| Other | SQL Filter, Consecutive Group, Time Group, Activity-Resource |
