Visual Analytics Transition Matrix
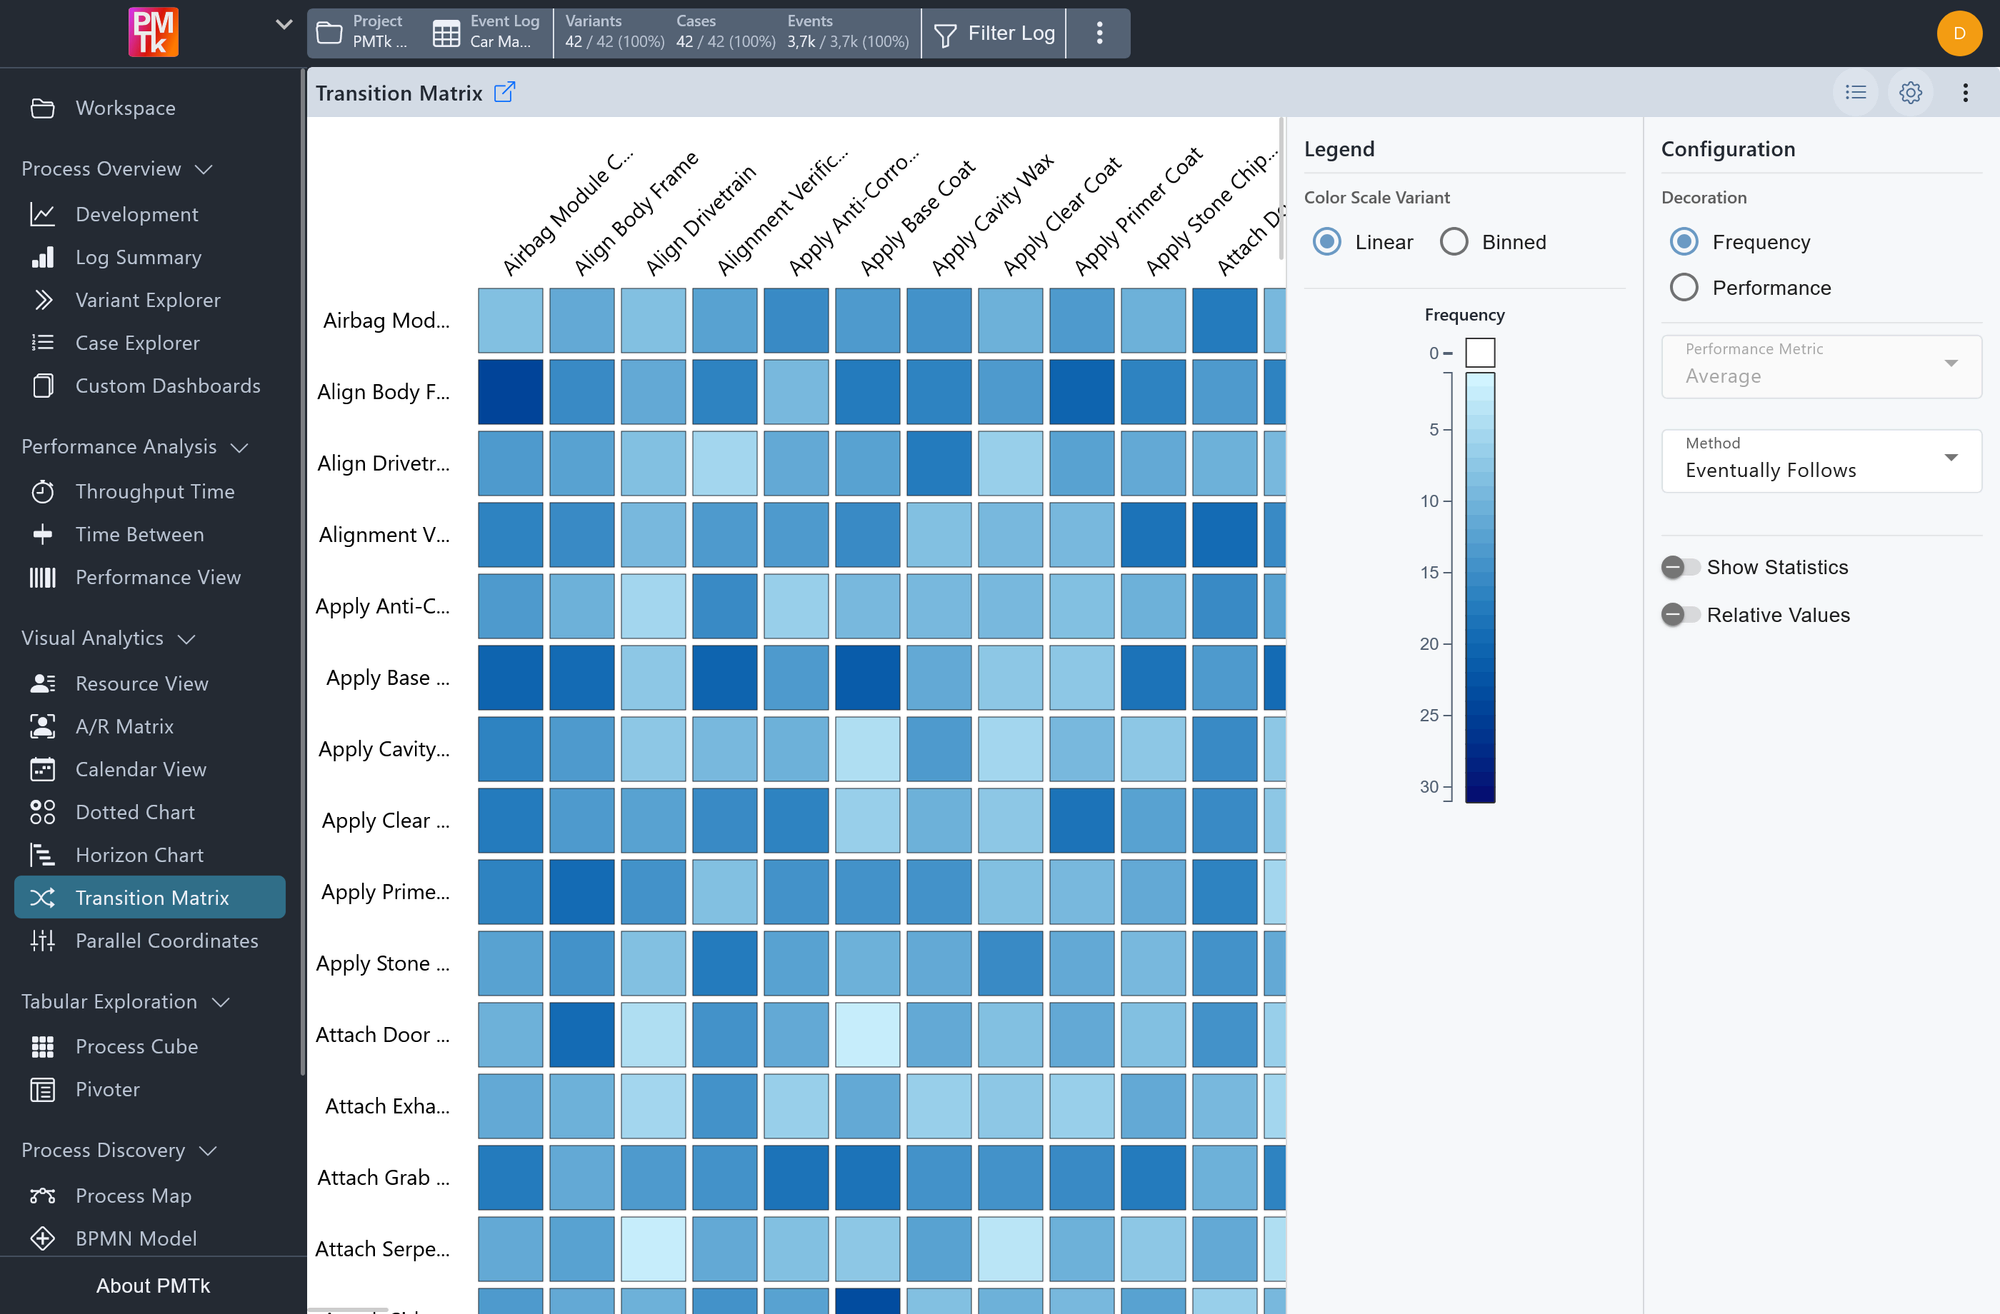
Screenshot shows the Transition Matrix visualizing how frequently each activity is followed by another in the process. The darker the cell color, the higher the number of recorded transitions from the row activity to the column activity.
The Transition Matrix provides a cross-tabular heatmap that maps activities (rows) to activities (columns), making it easy to understand how process steps relate to and follow one another. Each row represents a starting activity and each column represents an ending activity (a cell's color intensity reflects either how frequently or how performantly one activity transitions to another within the event log). Darker cells indicate stronger or more frequent transitions.
This view is particularly useful for identifying common process paths, unexpected activity sequences, or bottlenecks between specific process steps.
Transition Matrix Configuration
The legend panel and configuration panel provide the following settings.
| Setting | Description | Values |
|---|---|---|
| Color Scale Variant | Controls how metric values are mapped to colors. |
|
| Show Statistics | Toggles the display of statistical information within the matrix cells. |
|
| Relative Values | Toggles the use of relative values compared to the total occurrence in each row. |
|
| Decoration | Controls what the cell values represent. |
|
| Performance Metric | Determines how the time values are aggregated per cell. Requires Decoration: Performance. |
|
| Method | Defines what constitutes a transition between two activities. |
|
Transition Matrix Filtering
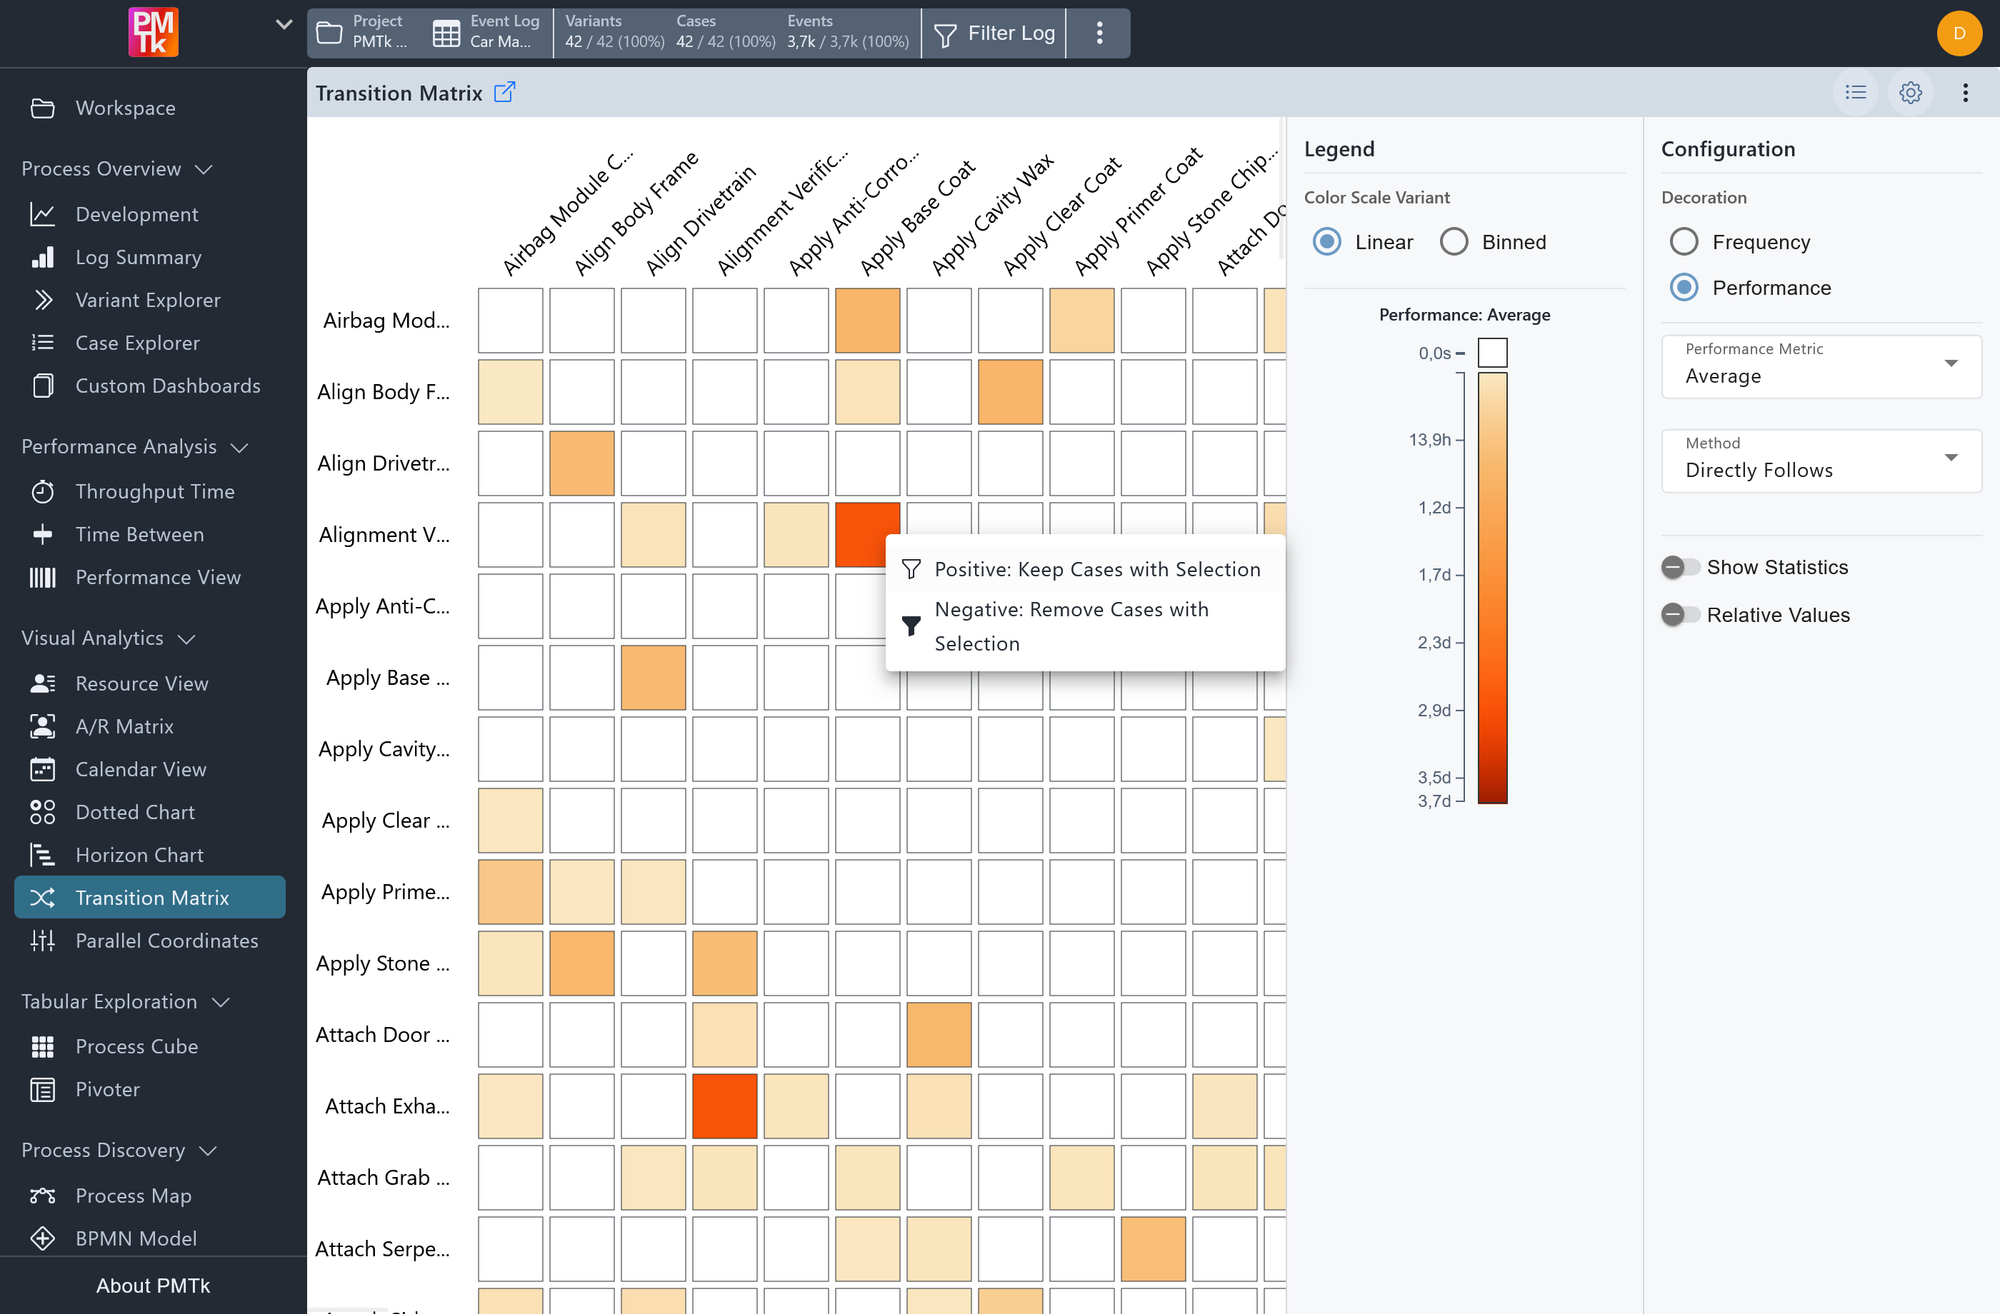
The image shows the filter mode selection in the transition matrix.
Clicking on any cell in the matrix opens a context menu that allows you to apply an Paths Filter scoped to that specific activity-to-activity transition. The following filter modes are available:
| Option | Effect |
|---|---|
| Positive: Keep Cases with Selection | Retains only cases that include at least one instance of the selected transition. |
| Negative: Remove Cases with Selection | Retains only cases that do not contain any instance of the selected transition. |
The filter is applied globally, restricting all downstream analyses and views. It is consistent with the Paths Filter applied elsewhere in PMTk and can be cleared or adjusted at any time through the filter controls in the top bar.
