Process Overview Variant Explorer
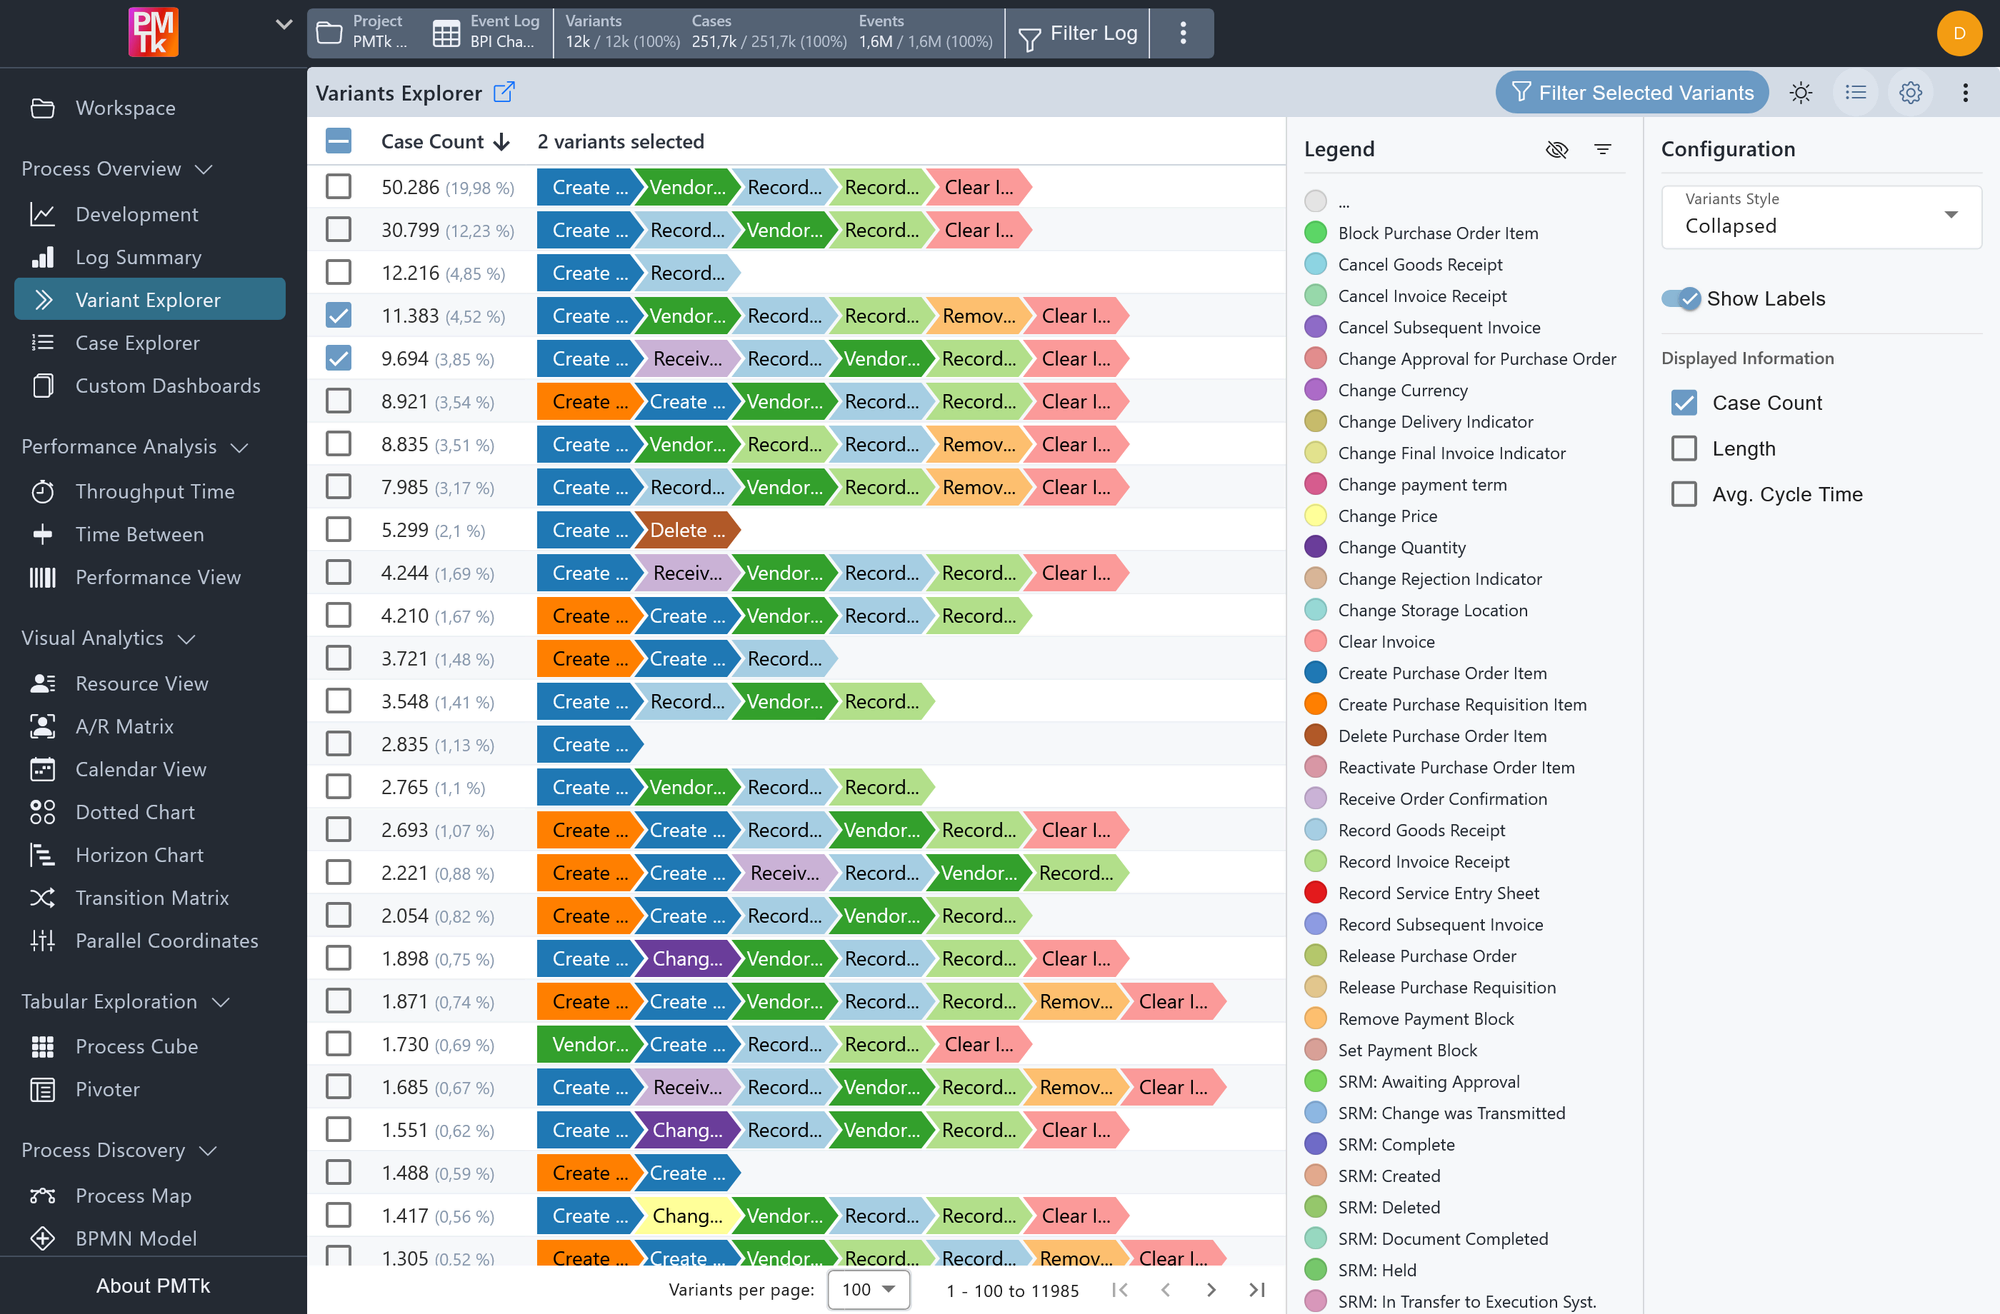
Screenshot shows the Variant Explorer, listing all process variants sorted by frequency, with two variants selected. Each row displays a variant as a sequence of color-coded activity chevrons, alongside its case count and share of the total log.
The Variant Explorer presents a ranked list of all process variants present in the event log, sorted by default in descending order of occurrence. Each row represents one unique variant (i.e., a distinct sequence of activities) displayed as a series of color-coded chevrons, with each chevron corresponding to one activity in the sequence. Colors are coded based on the activity names and correspond to those described in the legend.
By default, variants are sorted by frequency. The corresponding column shows both the absolute number of cases following that variant and its percentage share of the total event log (e.g., 50,286 Cases / 19.98% of Log). This makes it straightforward to assess how much of the overall process a given variant accounts for, and to quickly identify dominant and rare paths.
Variant Explorer Configuration
The configuration panel provides the following options.
| Setting | Description | Values |
|---|---|---|
| Variants Style | Controls how variant rows are rendered. |
|
| Show Labels | Toggles whether activity names are displayed inside the chevrons. |
|
| Displayed Information | Additional columns can be enabled or disabled to show supplementary statistics per variant. |
|
Legend
The Legend panel on the right lists every activity and its assigned color. Clicking an activity name in the legend toggles its color, dimming that activity everywhere it appears in PMTk to help it stand out (or fade) visually. Click to dim all colors, or to change how the entries are sorted.
Variant Explorer Filtering
Any number of variants can be selected using the checkboxes to the left of each row. The header checkbox selects or deselects all variants at once. The total number of currently selected variants is shown in the header row.
Once one or more variants are selected, clicking Filter Selected Variants in the toolbar opens the filter dialog, where you choose between two filtering modes:
| Option | Effect |
|---|---|
| Positive: Keep Selected Variants | Retains only cases whose variant matches one of the selected variants, removing all others from the event log. |
| Negative: Remove Selected Variants | Removes all cases whose variant matches one of the selected variants, retaining the rest. |
Clicking Apply in the dialog applies the resulting Variants Filter globally across all dashboards. You can clear or adjust the filter at any time through the filter controls in the top bar.
Sunburst Plot
Click in the toolbar to switch the Variant Explorer into Sunburst Plot view. The Sunburst Plot visualizes the distribution of process variants as a radial, layered chart.
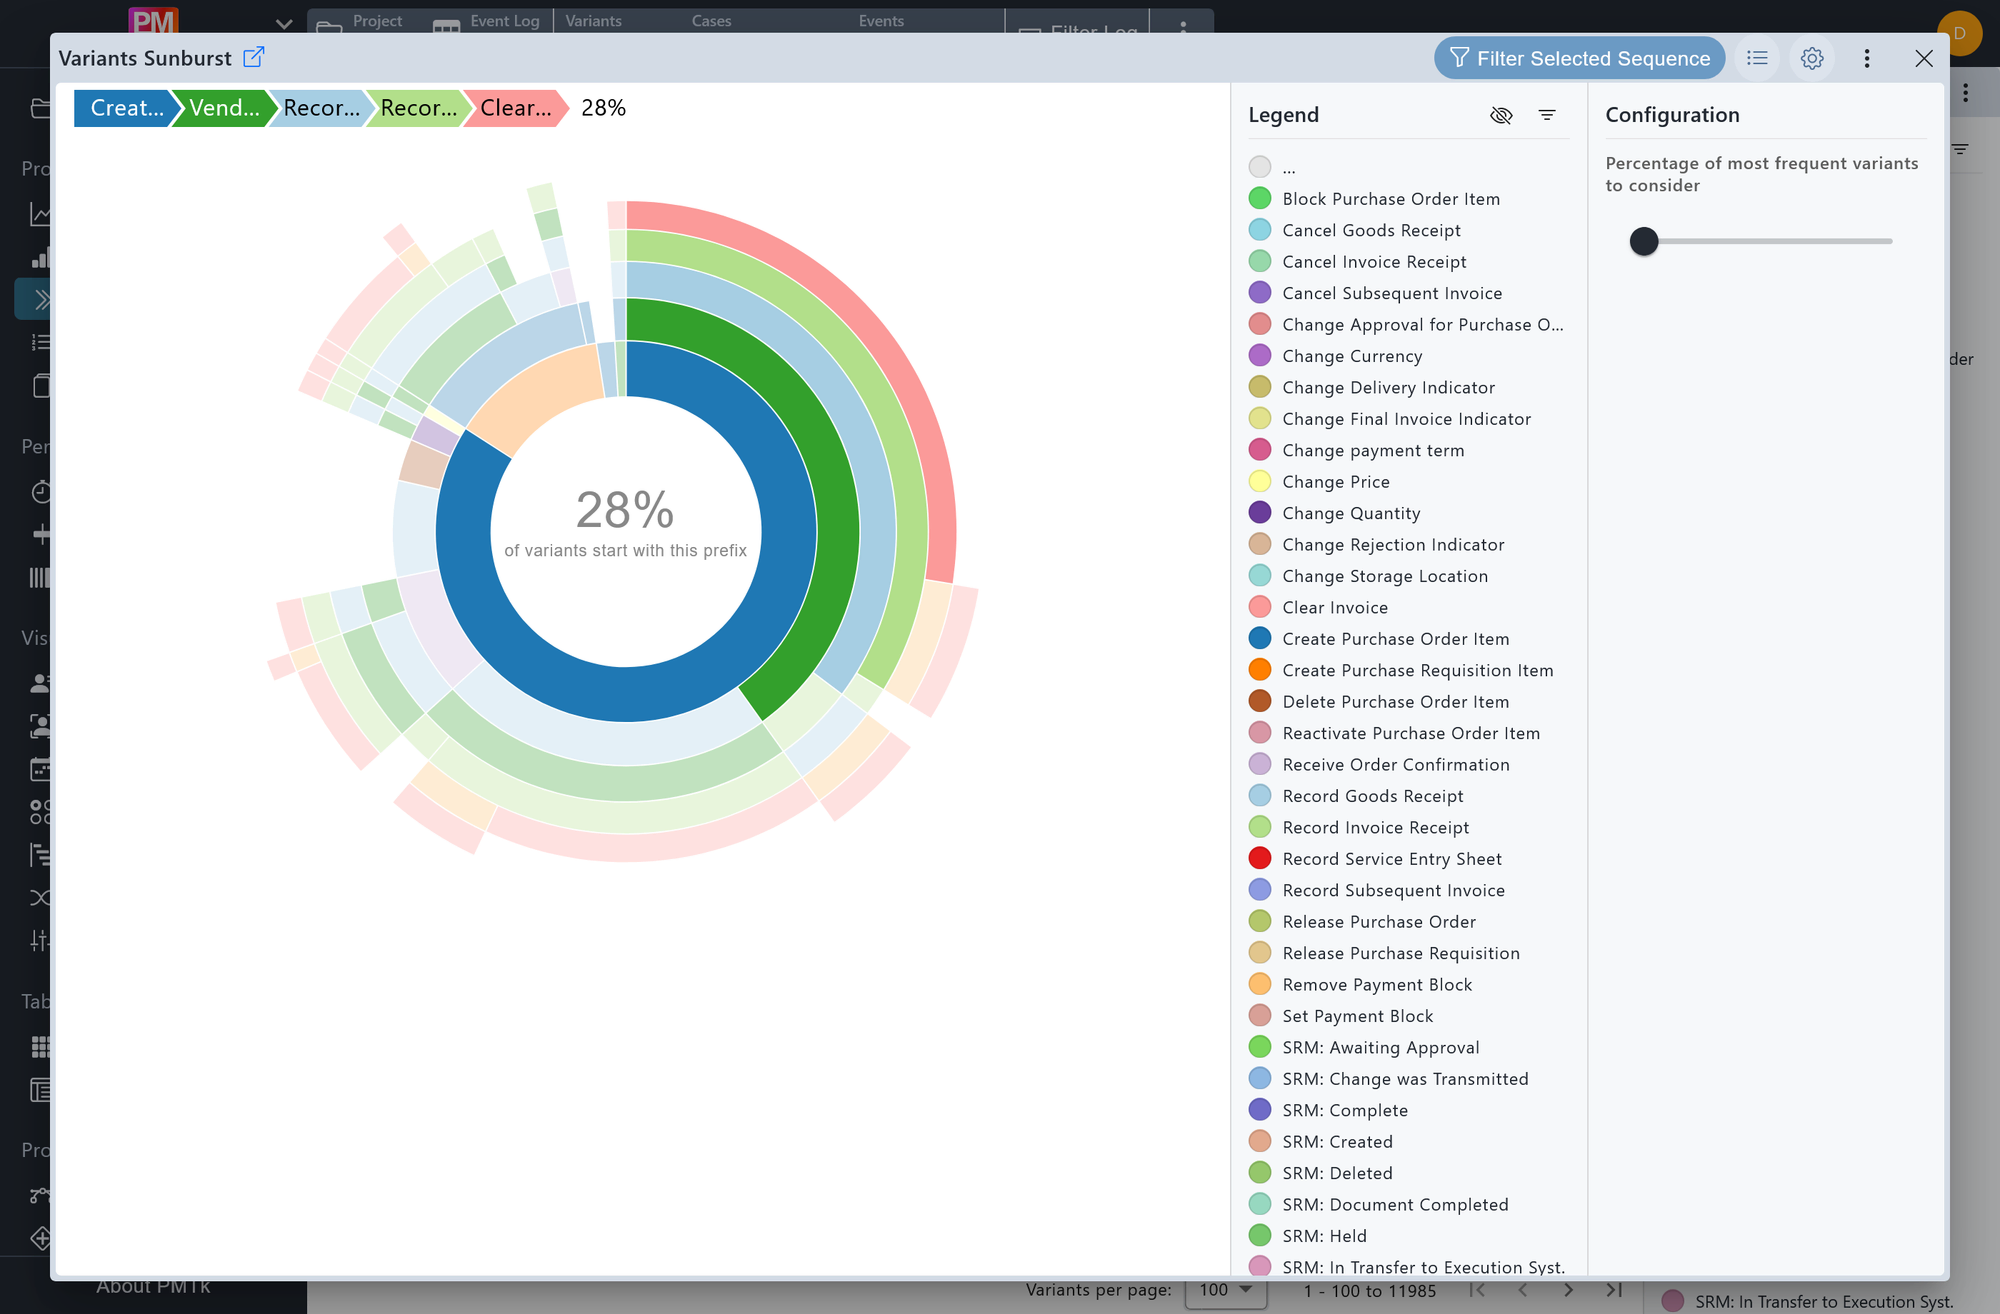
Screenshot shows the Sunburst Plot view of the Variant Explorer. Each ring represents one position in the activity sequence, with segment sizes proportional to the number of cases following that path. Activities are color-coded as seen in the legend on the right.
Each ring of the sunburst represents one position in the activity sequence (i.e., the innermost ring corresponds to the first activity of a case, the second ring to the second activity, and so on outward). Each segment within a ring is color-coded by activity name as seen in the legend, and its angular size reflects how many cases follow that particular path up to that point.
This view makes it easy to understand where process variants diverge: segments that take up a large arc indicate dominant activity sequences, while many small fragments in an outer ring signal high variability at that point in the process.
Sunburst Configuration
The configuration panel provides the following option, in addition to the ones described above:
| Setting | Description | Values |
|---|---|---|
| Percentage of Variants to Consider | The slider controls what portion of variants is rendered in the chart. For example, setting it to 10% means only the most frequent variants (10% of all variants) are included. Reducing this value simplifies the chart by focusing on the dominant paths; increasing it reveals more of the long tail of rarer variants. | 0% - 100% (default: % of top 100 variants) |
Sunburst Interaction & Filtering
| Interaction | Description |
|---|---|
| Select Prefix | Clicking on any segment in the chart selects the activity prefix leading up to and including that segment. When a segment is selected:
|
| Apply Trace Filter | With a prefix selected, clicking (the Apply Filter button) in the toolbar creates a Trace Filter that retains only cases whose activity sequence begins with the selected prefix. This filter propagates globally to all other components in the tool. |
