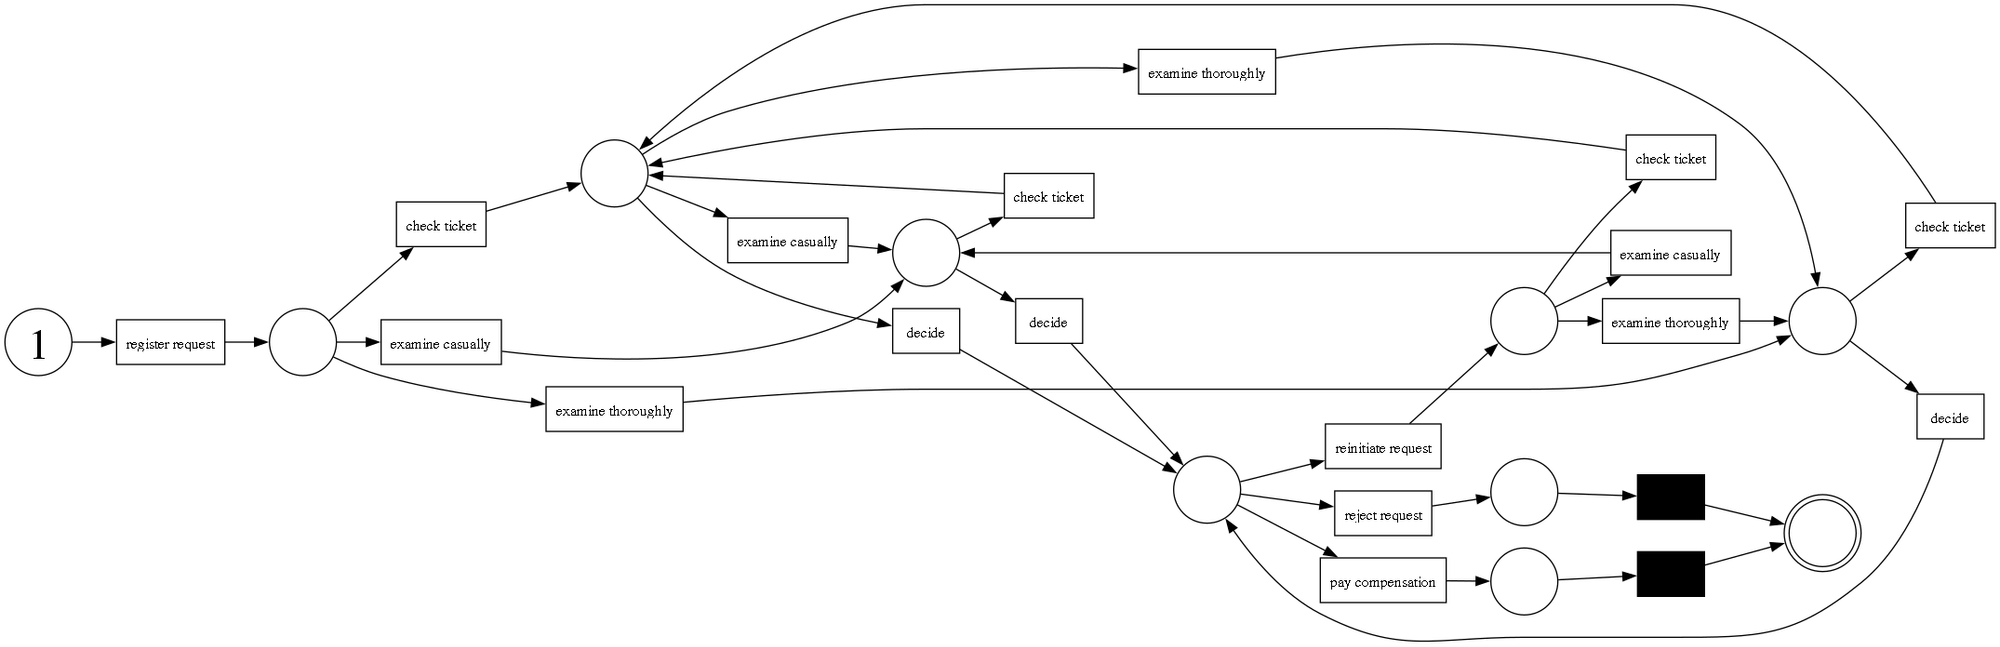
Directly Follows Graph
These examples use the Pandas DataFrame from event-data import. Compare graph filtering with filtering the underlying events, and explore performance statistics alongside the graph.
Directly-follows graphs (DFGs) are among the simplest types of process models. In these graphs, the nodes represent the activities, and the edges indicate how frequently one activity is followed by another. In PM4Py, we provide advanced operations on top of DFGs, including the discovery of the DFG along with the start and end activities of the log. This can be achieved using the following command:
import pm4py

if __name__ == "__main__":
    dfg: dict
    sa: dict
    ea: dict
    dfg, sa, ea = pm4py.discover_directly_follows_graph(log)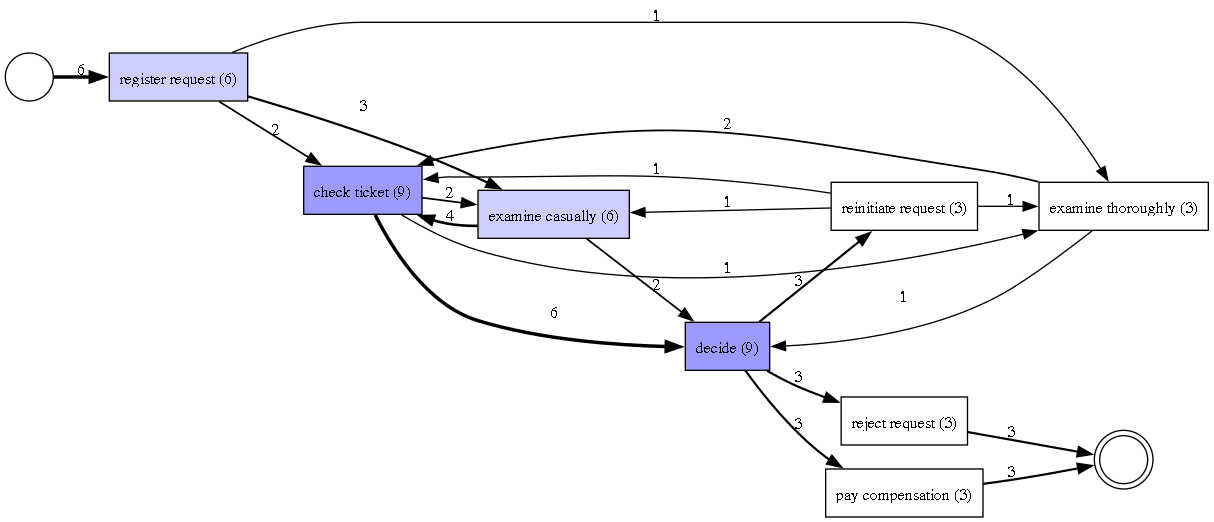
Alternatively, to discover the activities in the log along with their occurrence frequencies (assuming that concept:name is the attribute reporting the activity), use the following command:
import pm4py

if __name__ == "__main__":
    activities_count: dict[str, int] = pm4py.get_event_attribute_values(log, "concept:name")
Timeline DFG
Besides the classic frequency and performance views, PM4Py can visualize a DFG on a timeline. In this visualization, each activity is positioned according to its average temporal distance from the start of a case, which helps when you want to understand the typical progression of activities over time.
The timeline visualization combines a typed DFG with a mapping of activities to average relative timestamps. The helper clean_time.apply computes this timestamp mapping from the event log, while the timeline visualizer uses the DFG together with start and end activities to produce the final Graphviz object.
import pm4py
from pm4py.algo.discovery.dfg.variants import clean_time
from pm4py.visualization.dfg import visualizer as dfg_visualizer
from pm4py.visualization.dfg.variants import timeline as timeline_visualizer
import pandas
from graphviz import Graph
from pm4py.objects.dfg.obj import DFG

if __name__ == "__main__":
    dataframe: pandas.DataFrame = pm4py.read_xes("tests/input_data/running-example.xes")

    typed_dfg: DFG = pm4py.discover_dfg_typed(dataframe)
    dfg_time: dict = clean_time.apply(dataframe)

    gviz: Graph = timeline_visualizer.apply(
        typed_dfg.graph,
        dfg_time,
        parameters={
            "format": "svg",
            "start_activities": typed_dfg.start_activities,
            "end_activities": typed_dfg.end_activities
        }
    )
    dfg_visualizer.view(gviz)
Filtering Activities/Paths
Directly-follows graphs can contain a large number of activities and paths, some of which may be outliers. In this section, we demonstrate how to filter the activities and paths of the graph, retaining only a subset of the behavior. First, we load an example log and calculate the DFG.
import pm4py
import pandas

if __name__ == "__main__":
    log: pandas.DataFrame = pm4py.read_xes("tests/input_data/running-example.xes")
    dfg: dict
    sa: dict
    ea: dict
    dfg, sa, ea = pm4py.discover_directly_follows_graph(log)
    activities_count: dict[str, int] = pm4py.get_event_attribute_values(log, "concept:name")
The following snippet applies filtering based on the percentage of activities. The most frequent activities, as defined by the percentage, are retained along with all activities that are necessary to maintain graph connectivity. If a percentage of 0% is specified, only the most frequent activity (and those that ensure connectivity) is kept. For example, setting the percentage to 0.2 keeps 20% of the activities. The filter is applied simultaneously to the DFG, start activities, end activities, and the dictionary of activity occurrences to ensure consistency.
from pm4py.algo.filtering.dfg import dfg_filtering

if __name__ == "__main__":
    dfg: dict
    sa: dict
    ea: dict
    activities_count: dict[str, int]
    dfg, sa, ea, activities_count = dfg_filtering.filter_dfg_on_activities_percentage(
        dfg, sa, ea, activities_count, 0.2
    )
The following snippet demonstrates how to filter paths based on their percentage. The most frequent paths, defined by the percentage, are retained along with any paths necessary to maintain connectivity. If 0% is specified, only the most frequent path (and those ensuring connectivity) is kept. For example, setting the percentage to 0.2 keeps 20% of the paths. Similar to activity filtering, this filter is applied concurrently to the DFG, start activities, end activities, and the activity occurrences dictionary.
from pm4py.algo.filtering.dfg import dfg_filtering

if __name__ == "__main__":
    dfg: dict
    sa: dict
    ea: dict
    activities_count: dict[str, int]
    dfg, sa, ea, activities_count = dfg_filtering.filter_dfg_on_paths_percentage(
        dfg, sa, ea, activities_count, 0.2
    )
Playout of a DFG
Playout returns a legacy EventLog, whose length counts traces. Use pm4py.convert_to_dataframe to analyze the generated events with Pandas.
A playout operation on a DFG is useful for retrieving the traces allowed by the graph. A trace represents a sequence of activities from the start node to the end node of the DFG. We can assign a probability to each trace, assuming the DFG represents a Markov chain. This section shows how to perform the playout of a DFG to retrieve the most likely traces. First, we load an example log and calculate the DFG.
import pm4py
import pandas

if __name__ == "__main__":
    log: pandas.DataFrame = pm4py.read_xes("tests/input_data/running-example.xes")
    dfg: dict
    sa: dict
    ea: dict
    dfg, sa, ea = pm4py.discover_directly_follows_graph(log)
    activities_count: dict[str, int] = pm4py.get_event_attribute_values(log, "concept:name")
Once the DFG is computed, we can perform the playout operation as follows:
from pm4py.objects.log.obj import EventLog
if __name__ == "__main__":
    simulated_log: EventLog = pm4py.play_out(dfg, sa, ea)
Alignments on a DFG
Alignments are a popular conformance checking technique, typically applied to Petri nets. However, performing alignments on a DFG can be more efficient because the state space of a DFG is much smaller. This allows for quick diagnostics of activities and paths that are executed incorrectly. In this section, we demonstrate how to perform alignments between process executions and a DFG. First, we load an example log and calculate the DFG.
import pm4py
import pandas

if __name__ == "__main__":
    log: pandas.DataFrame = pm4py.read_xes("tests/input_data/running-example.xes")
    dfg: dict
    sa: dict
    ea: dict
    dfg, sa, ea = pm4py.discover_directly_follows_graph(log)
    activities_count: dict[str, int] = pm4py.get_event_attribute_values(log, "concept:name")
Once the DFG is computed, we can perform alignments between the process executions of the log and the DFG:
from typing import Any
if __name__ == "__main__":
    alignments: list[dict[str, Any]] = pm4py.conformance_diagnostics_alignments(simulated_log, dfg, sa, ea)
The output of the alignment process is similar to the one obtained for Petri nets. It consists of a list for each trace showing the result of the alignment, including sync moves, moves on the log (where a move in the process execution is not reflected in the DFG), and moves on the model (where a move is needed in the model but not supported by the process execution).
Convert Directly-Follows Graph to a Workflow Net
The Directly-Follows Graph (DFG) is a common representation of a process used by many commercial tools. Sander Leemans proposed the idea of converting the DFG into a workflow net that perfectly mimics the DFG, a process known as DFG mining. The following steps describe how to load a log, calculate the DFG, convert it to a workflow net, and perform alignments.
import pm4py
import os
import pandas
from pm4py.objects.petri_net.obj import Marking, PetriNet

if __name__ == "__main__":
    log: pandas.DataFrame = pm4py.read_xes(os.path.join("tests", "input_data", "running-example.xes"))

    from pm4py.algo.discovery.dfg import algorithm as dfg_discovery
    dfg: dict = dfg_discovery.apply(log)

    from pm4py.objects.conversion.dfg import converter as dfg_mining
    net: PetriNet
    im: Marking
    fm: Marking
    net, im, fm = dfg_mining.apply(dfg)