Handling Data Connector
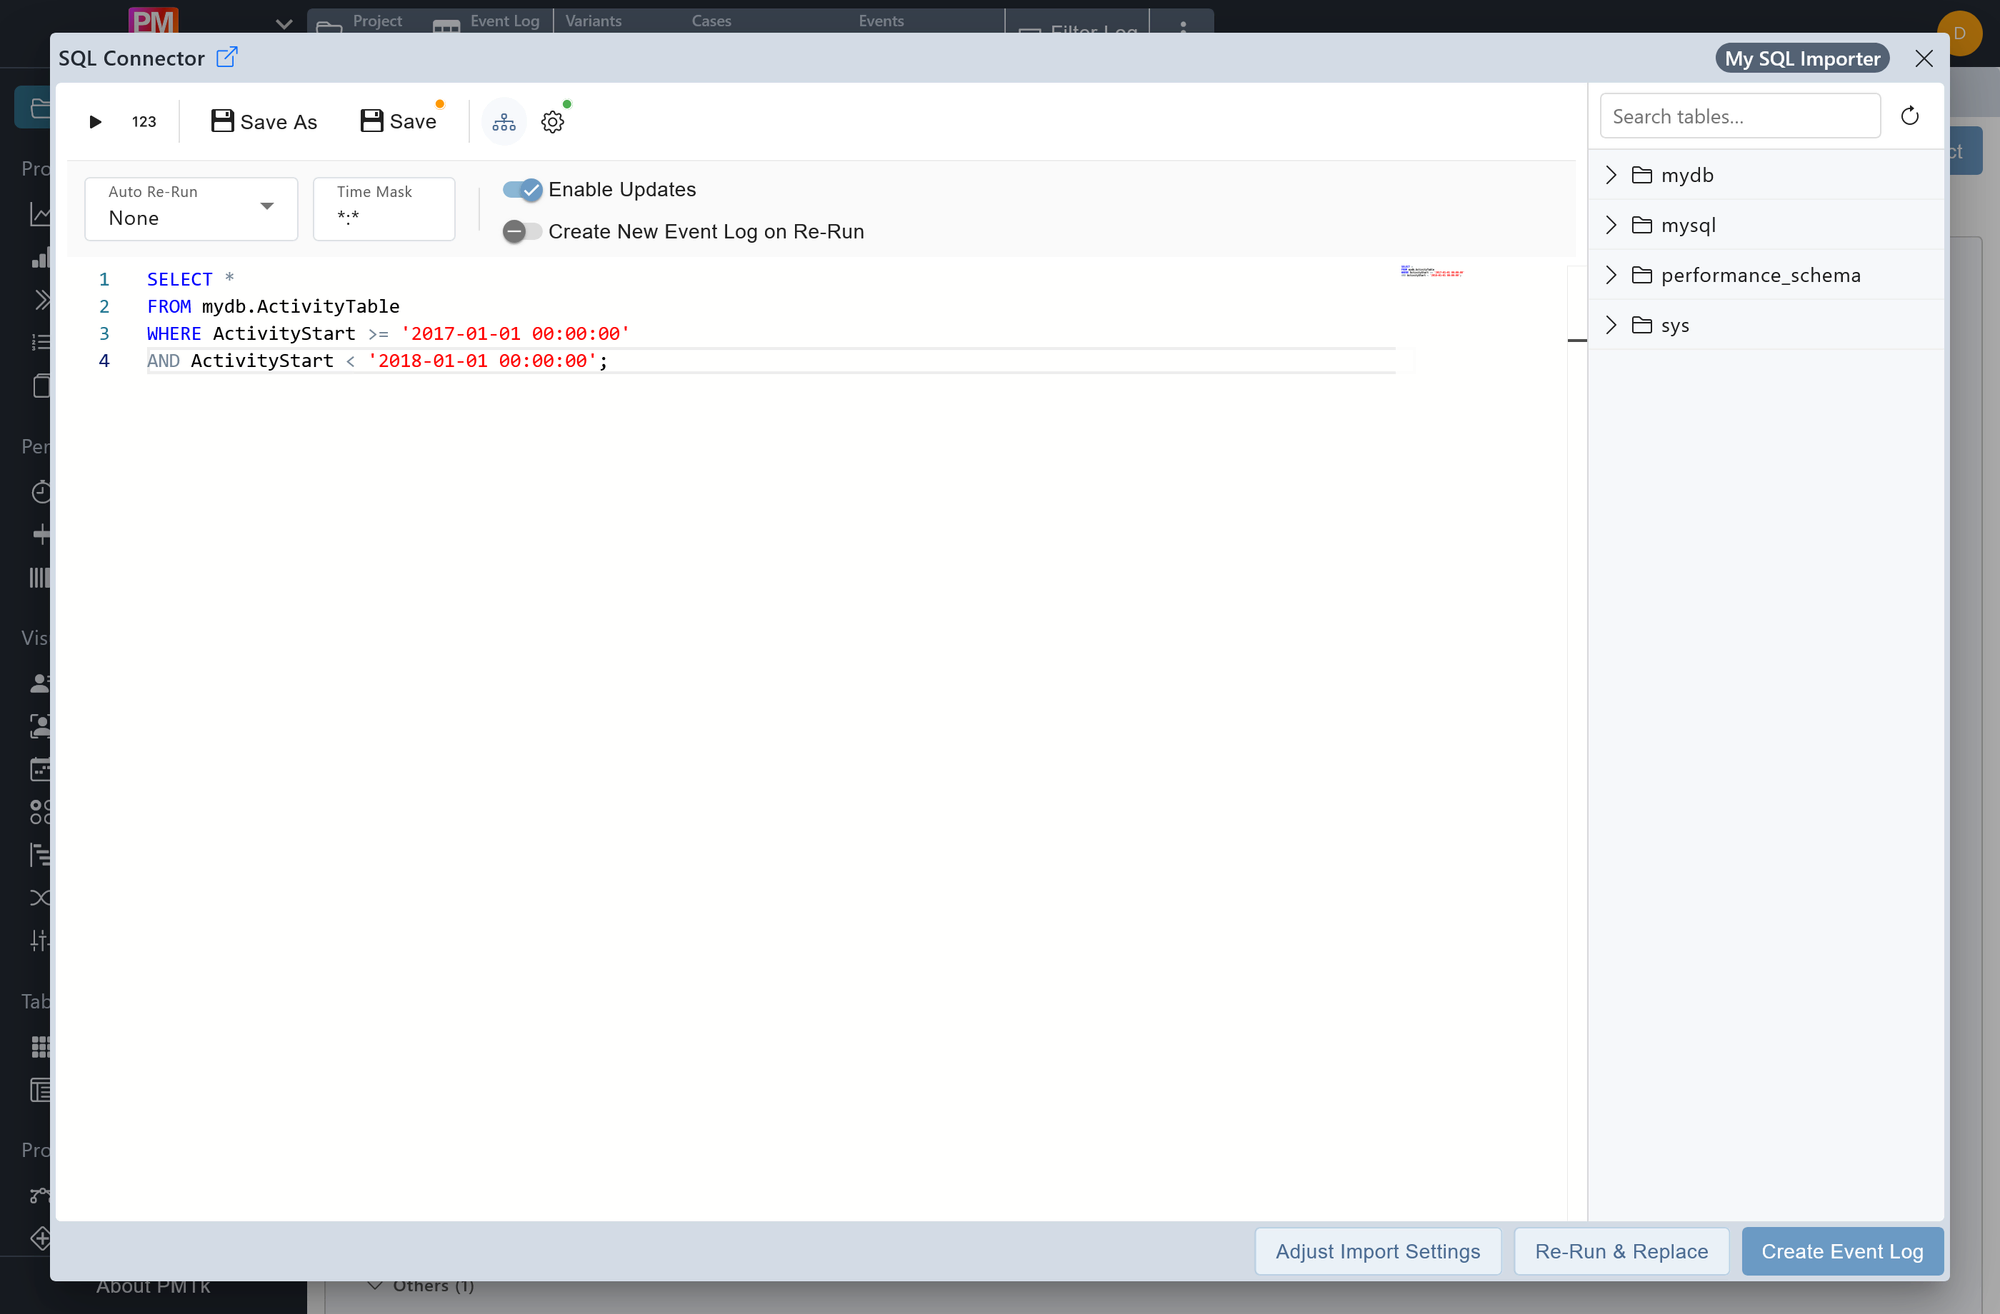
Screenshot shows the SQL Importer dialog with a query that fetches all activities from a specific time range. The Auto re-run schedule, Time mask, and update settings are visible above the query editor. The Table Browser panel on the right lists the available schemas and tables.
A Connector is an alternative way to import event log data into PMTk alongside CSV and XES imports. Instead of uploading a file, you connect to an external data source and write a query that fetches the data directly. This is particularly useful for keeping event logs up to date automatically via scheduled re-runs.
PMTk currently offers two connector types:
- SQL Connector: connects to a relational SQL database server.
- SAP Connector: connects to an SAP system. Only SAP S/4HANA is currently supported; let us know if you need us to support another SAP connection method.
Connectors are opened by clicking on a SQL Connector or SAP Connector artefact in the Workspace. New connector artefacts are created there as well. Access is limited to the Admin role or above.
Note for Docker deployments
The Connectors may need to be explicitly enabled. Add the following entry to the environment section of the pm4py-backend-stand service in your docker-compose.yml:
PM4PYWS_ENABLE_SQL_IMPORTER: yesConnector Connection
Click the gear icon in the toolbar to open the Connection Configuration dialog. Fill in the connection details, click Test Connection to verify them (PMTk will report where the connection attempt failed if it does not succeed; contact us if you need assistance), and click Apply to save them. Do not forget to also save the connector artefact itself via Save afterwards.
SQL Connection
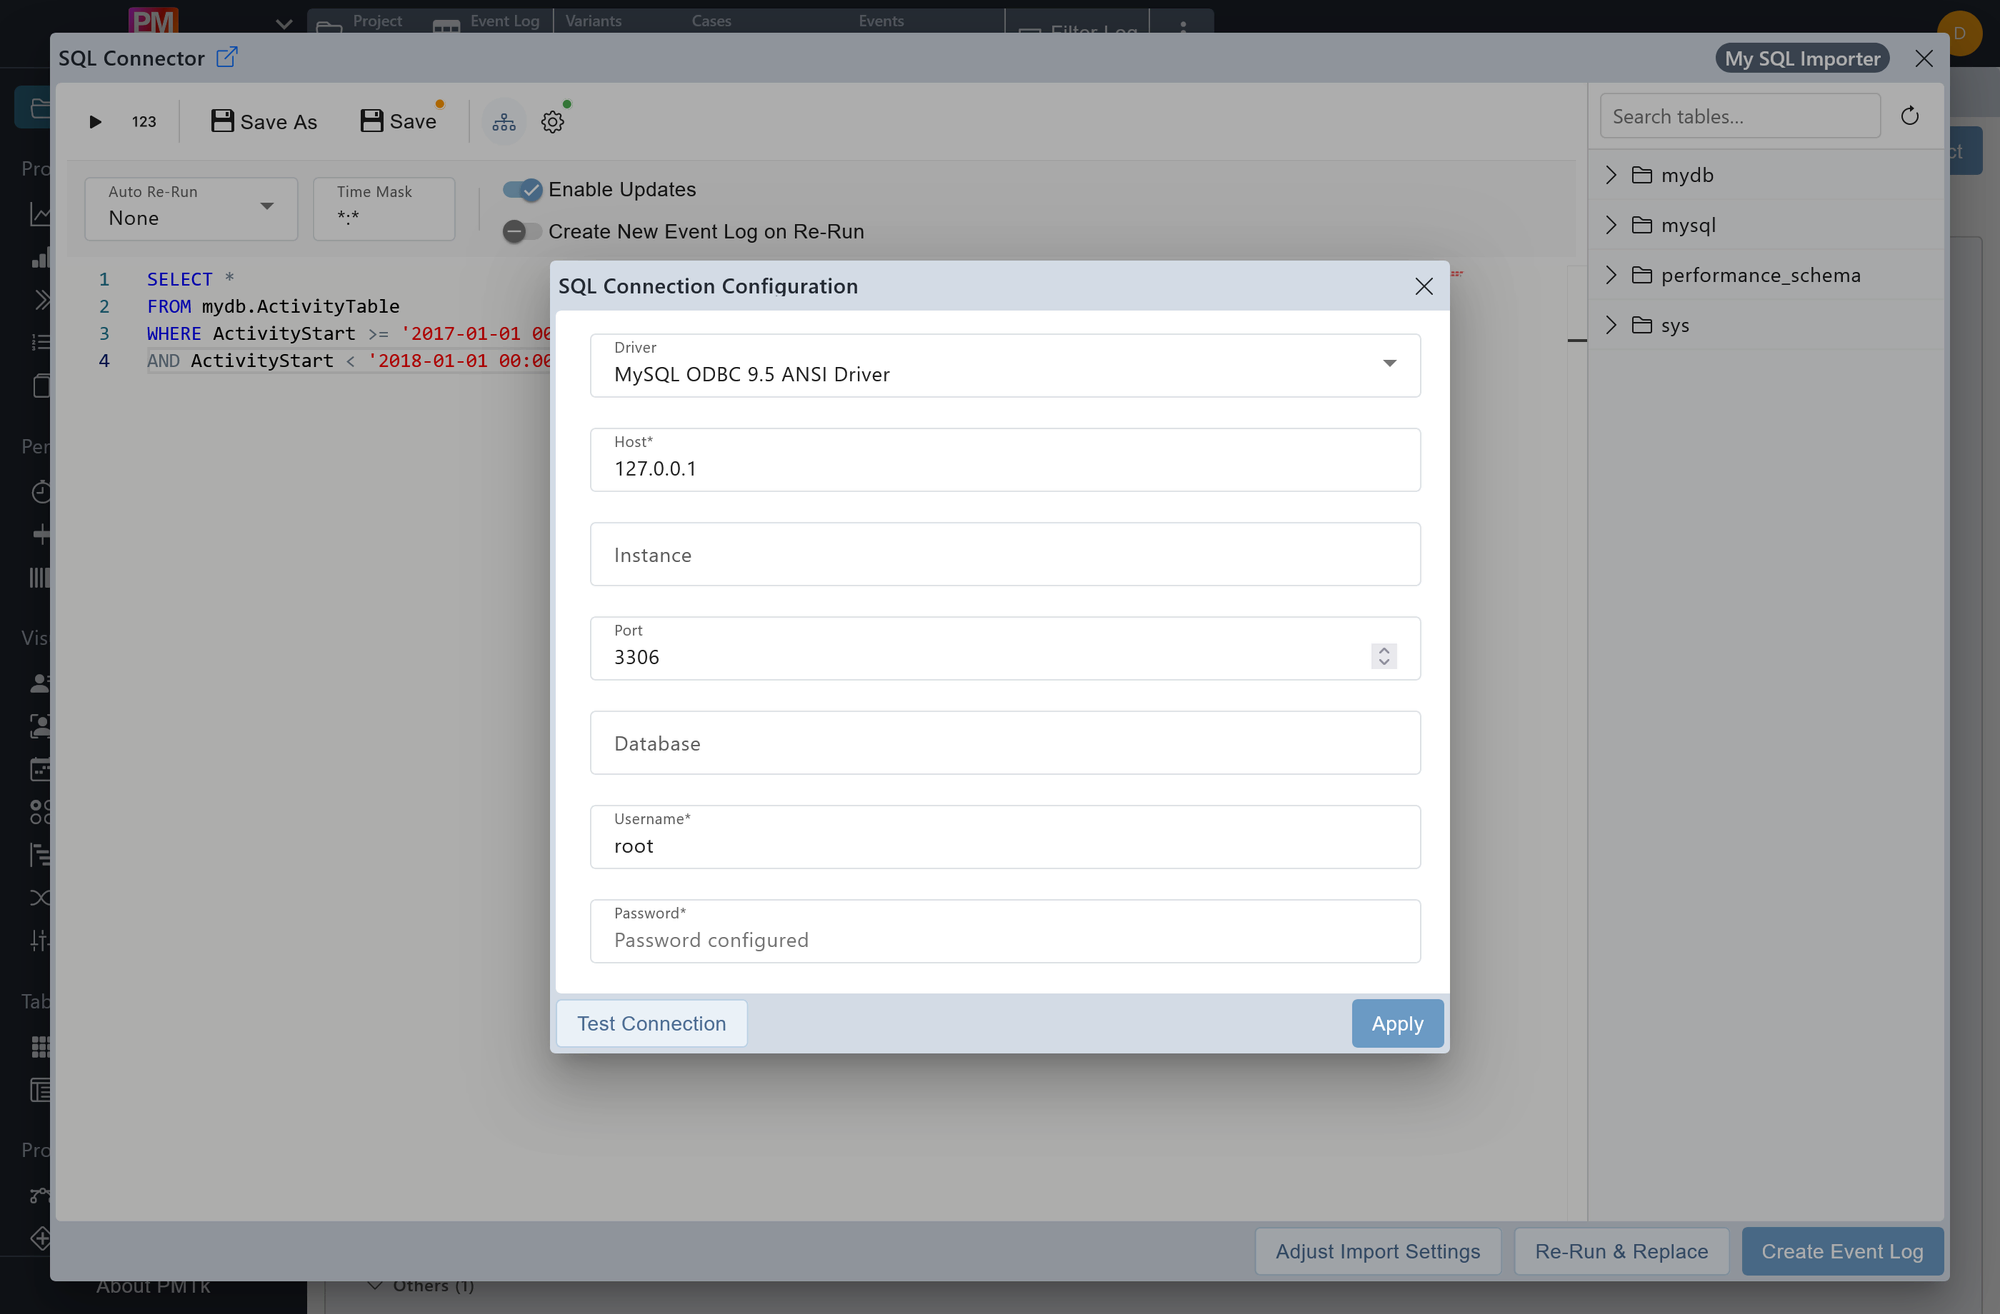
Screenshot shows the SQL Connection Configuration dialog. The driver is set to ODBC Driver 18 for SQL Server and the port defaults to 1433.
| Field | Description |
|---|---|
| Driver | The ODBC driver used to connect to your database server. If no suitable driver is available for your SQL server, please contact us. |
| Host | The hostname or IP address of the database server. |
| Instance (optional) | The named SQL Server instance, if applicable. |
| Port | The port the database server listens on. Defaults to 1433 for SQL Server. |
| Database (optional) | The name of the specific database to connect to. |
| Username | The database user account. |
| Password | The password for the database user account. |
SAP Connection
| Field | Description |
|---|---|
| SAP System | The SAP system to connect to. Only SAP S/4HANA is currently supported. |
| Host | The hostname or IP address of the SAP system. |
| Port | The port the SAP system listens on. |
| Database (optional) | The name of the specific database to connect to. |
| Encrypt | Encrypts the connection to the SAP system. |
| SSL Validate Certificates | Validates the SAP system's SSL certificate when the connection is encrypted. |
| Username | The SAP user account. |
| Password | The password for the SAP user account. |
Table Browser
Click in the toolbar to toggle the Table Browser panel on the right side of the dialog (visible in the screenshot above). Use the search field to find a table by name, or browse the schema tree to locate it. Expand a table to inspect its columns and their data types. Click beside a schema, table, or column to insert a reference to it into the query at the current cursor position.
Writing the Query
SQL Connector
Write your SQL query directly in the editor.
A common pattern is to fetch a rolling time window from the database on every scheduled re-run, for example, all activities from the last 60 days:
SELECT *
FROM mydb.ActivityTable
WHERE ActivityStart >= DATEADD(DAY, -60, GETDATE())
ORDER BY ActivityStart;
SAP Connector
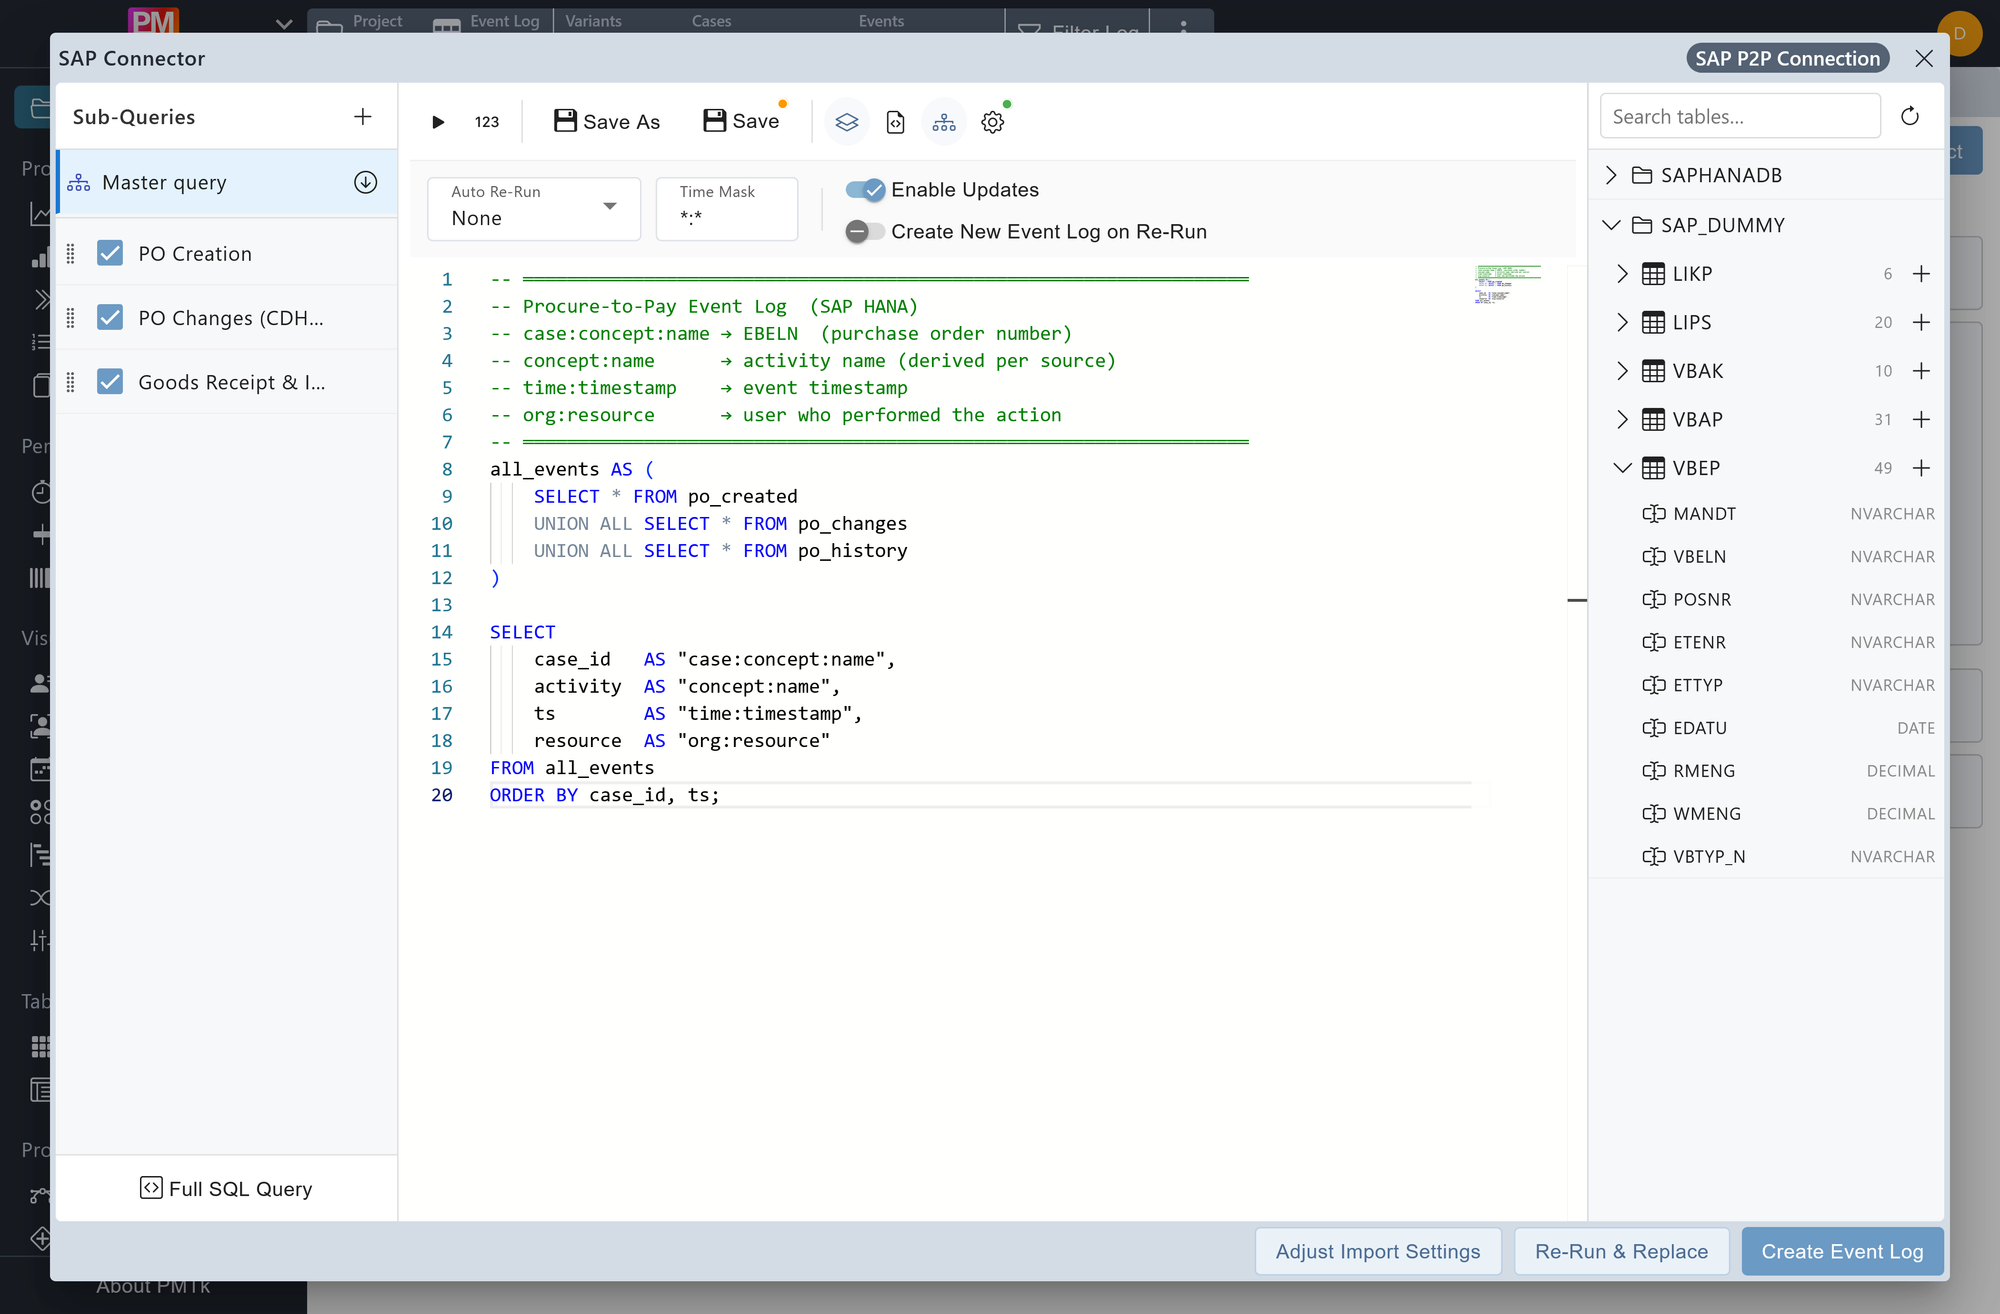
Screenshot shows the SAP Connector dialog with the Sub-Queries panel expanded on the left, three sub-queries feeding into the selected Master query, and the Table Browser panel on the right showing the columns of the VBEP table.
Instead of a single query, the SAP Connector lets you compose the query from any number of Sub-Queries in the panel on the left, click in the toolbar to toggle its visibility. Each sub-query becomes a CTE (Common Table Expression) in the compiled SQL statement (i.e. a WITH subquery1 AS ( SELECT ... FROM ... ) block). Click + at the top of the panel to add a new sub-query.
Every sub-query has a Name, shown in the Sub-Queries list, and an Id, used to reference it from other sub-queries or from the Master query (e.g. FROM subquery_id).
Use the handle on the left of a sub-query to reorder it within the list, and its checkbox to enable or disable it without removing it; disabled sub-queries are excluded from the compiled query.
The Master query is pinned at the top of the panel and forms the bottom-most, final part of the compiled query (i.e. the outer SELECT that runs once all sub-query CTEs are defined). This is where you combine and shape your sub-queries into the event log you want.
Click Full SQL Query at the bottom of the Sub-Queries panel to view the entire compiled query as plain SQL, with each sub-query preceded by a -- ─── NAME comment above its subquery_id AS ( ... ) block. You can edit this combined query directly; click Parse & Apply to parse your changes back into individual sub-queries, or Cancel to discard them. Do not forget to Save the connector artefact before applying your changes.
Click in the toolbar to insert a query template, a ready-made example query you can adapt as a starting point.
Note
The Sub-Queries feature is currently only available for the SAP Connector. Support for the SQL Connector is planned for a future release.
Running & Saving
The following controls are available in the toolbar once the query (or, for the SAP Connector, the compiled Sub-Queries) is ready:
| Control | Description |
|---|---|
| Run | Executes the query and displays the result, so you can verify that it returns the expected data. |
| Count Result Rows | Fetches and displays the number of rows the query currently produces, without creating an event log. Useful to sanity-check the result before committing to Create Event Log. |
| Create Event Log | Opens the same three-step import dialog as a CSV import (see Importing Data & Models for details). The resulting event log artefact is saved in the active project in the Workspace. |
| Adjust Import Settings | Available once a connector has an established, saved import configuration (i.e. an event log has already been created from it). Reopens the same three-step import dialog as Create Event Log, letting you revisit and adjust those settings. |
| Save As | Saves the connector configuration as a copy under a new name. |
| Save | Saves the connector artefact. Make sure to save before closing the dialog to preserve any changes to the query (or Sub-Queries), connection settings, or auto re-run schedule. |
Auto Re-run
Once the connector is saved and an initial event log has been created, you can configure automatic scheduled re-runs to keep the event log up to date without manual intervention.
| Setting | Description |
|---|---|
| Auto re-run | The re-run schedule. Options are No schedule, Every hour, Every day, and Every week. |
| Time mask | The time at which the re-run should execute within the chosen schedule period. Accepts exact times (e.g. 09:30) or wildcards (e.g. *:* for any time, 14:* for any minute past 14:00). All times are interpreted in UTC. |
| Enable updates | Activates or pauses the scheduled re-run without removing the schedule configuration. |
| Create new event log on re-run | When disabled (default), each re-run replaces the existing event log artefact with fresh data. When enabled, each re-run creates a new event log artefact instead, preserving the previous one. |
When updates are active, a Rerun & Replace button appears next to Create Event Log, allowing you to trigger a re-run manually at any time without waiting for the next scheduled execution.
