Visual Analytics Parallel Coordinates
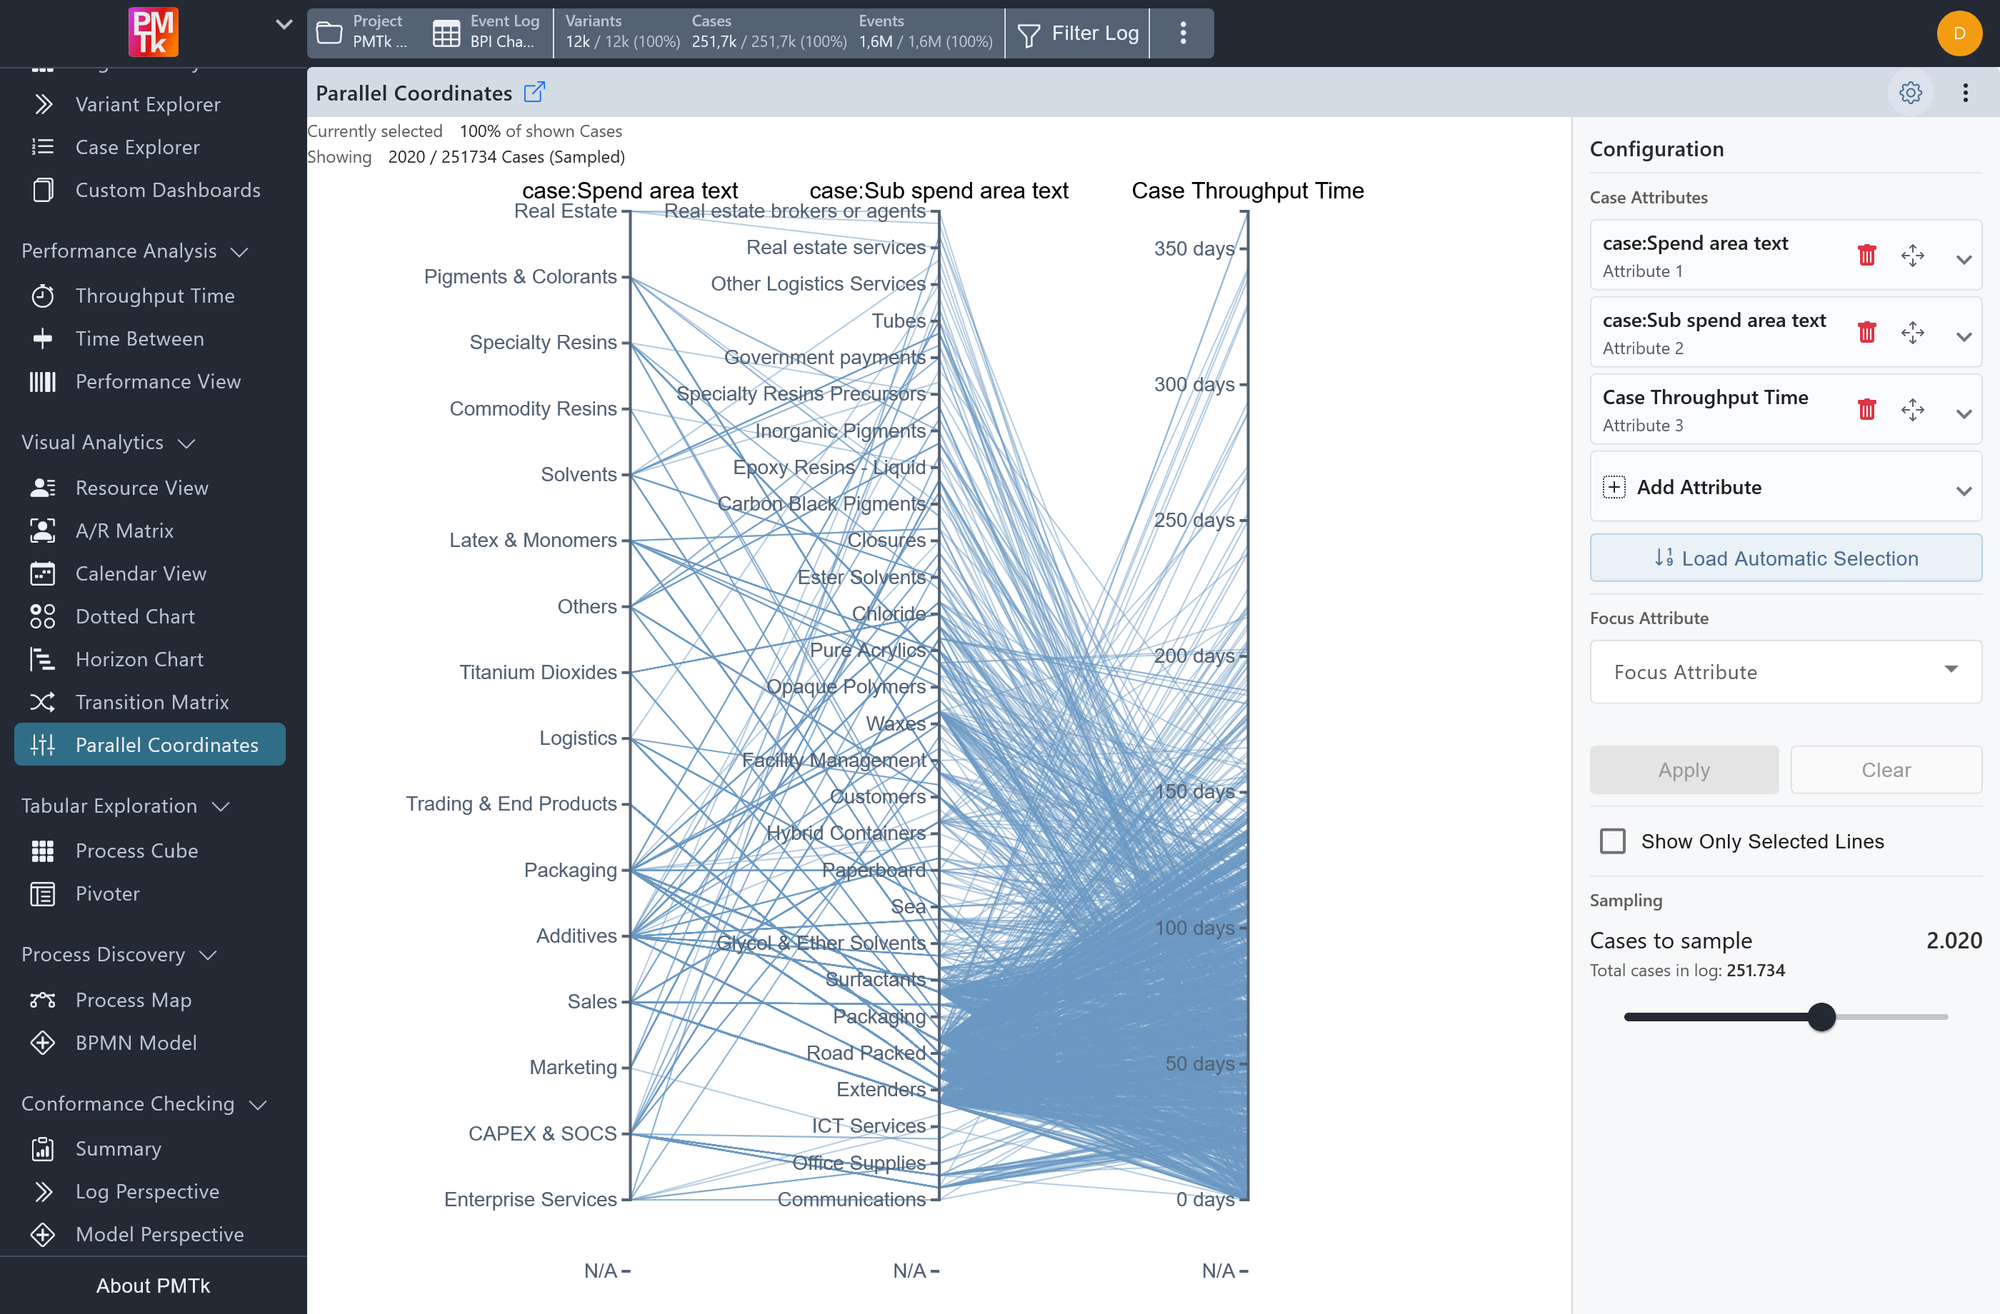
Screenshot shows the Parallel Coordinates view with three case attributes selected as axes: Spend area text, Sub spend area text, and Case Throughput Time. Each line represents one sampled case, connecting its values across all three axes.
The Parallel Coordinates view visualizes relationships between multiple case attributes simultaneously. Each vertical axis represents one selected case attribute, and each line connecting the axes represents one individual case, with its path across the axes reflecting the values that case holds for each attribute. By observing how lines cluster, cross, or spread between axes, patterns and correlations between attributes become immediately apparent.
The view displays a configurable sample of cases from the total event log, shown in the header below the title.
Parallel Coordinates Configuration
The configuration panel provides the following options.
| Control | Description |
|---|---|
| Add Attribute | Click on Add Attribute to expand the form and add a new attribute to the sequence. |
| Order Attributes | Each attribute is labeled by its position (Attribute 1, Attribute 2, Attribute 3, ...) and can be reordered using the drag handles , or removed using the trash icon . |
| Load Automatic Selection | Clicking Load Automatic Selection automatically populates the attribute list with a suggested set of case attributes based on the event log, providing a useful starting point. |
| Focus Attribute | Allows coloring all lines based on the values of one of the selected case attributes. Select the desired attribute from the Focus Attribute dropdown, then click Apply to update the chart. Each distinct value (for categorical attributes) or range (for numerical attributes) is assigned a unique color, and a legend appears on the right-hand side mapping colors to values. The coloring can be reverted at any time by clicking Clear. |
| Show Only Selected Lines | When enabled, lines that fall outside any active axis highlighting are hidden entirely rather than being greyed out. Disabled by default. |
| Cases to Sample | The slider controls how many cases are drawn from the total event log for display. The total case count is shown for reference. Reducing the sample size improves rendering performance for large logs. |
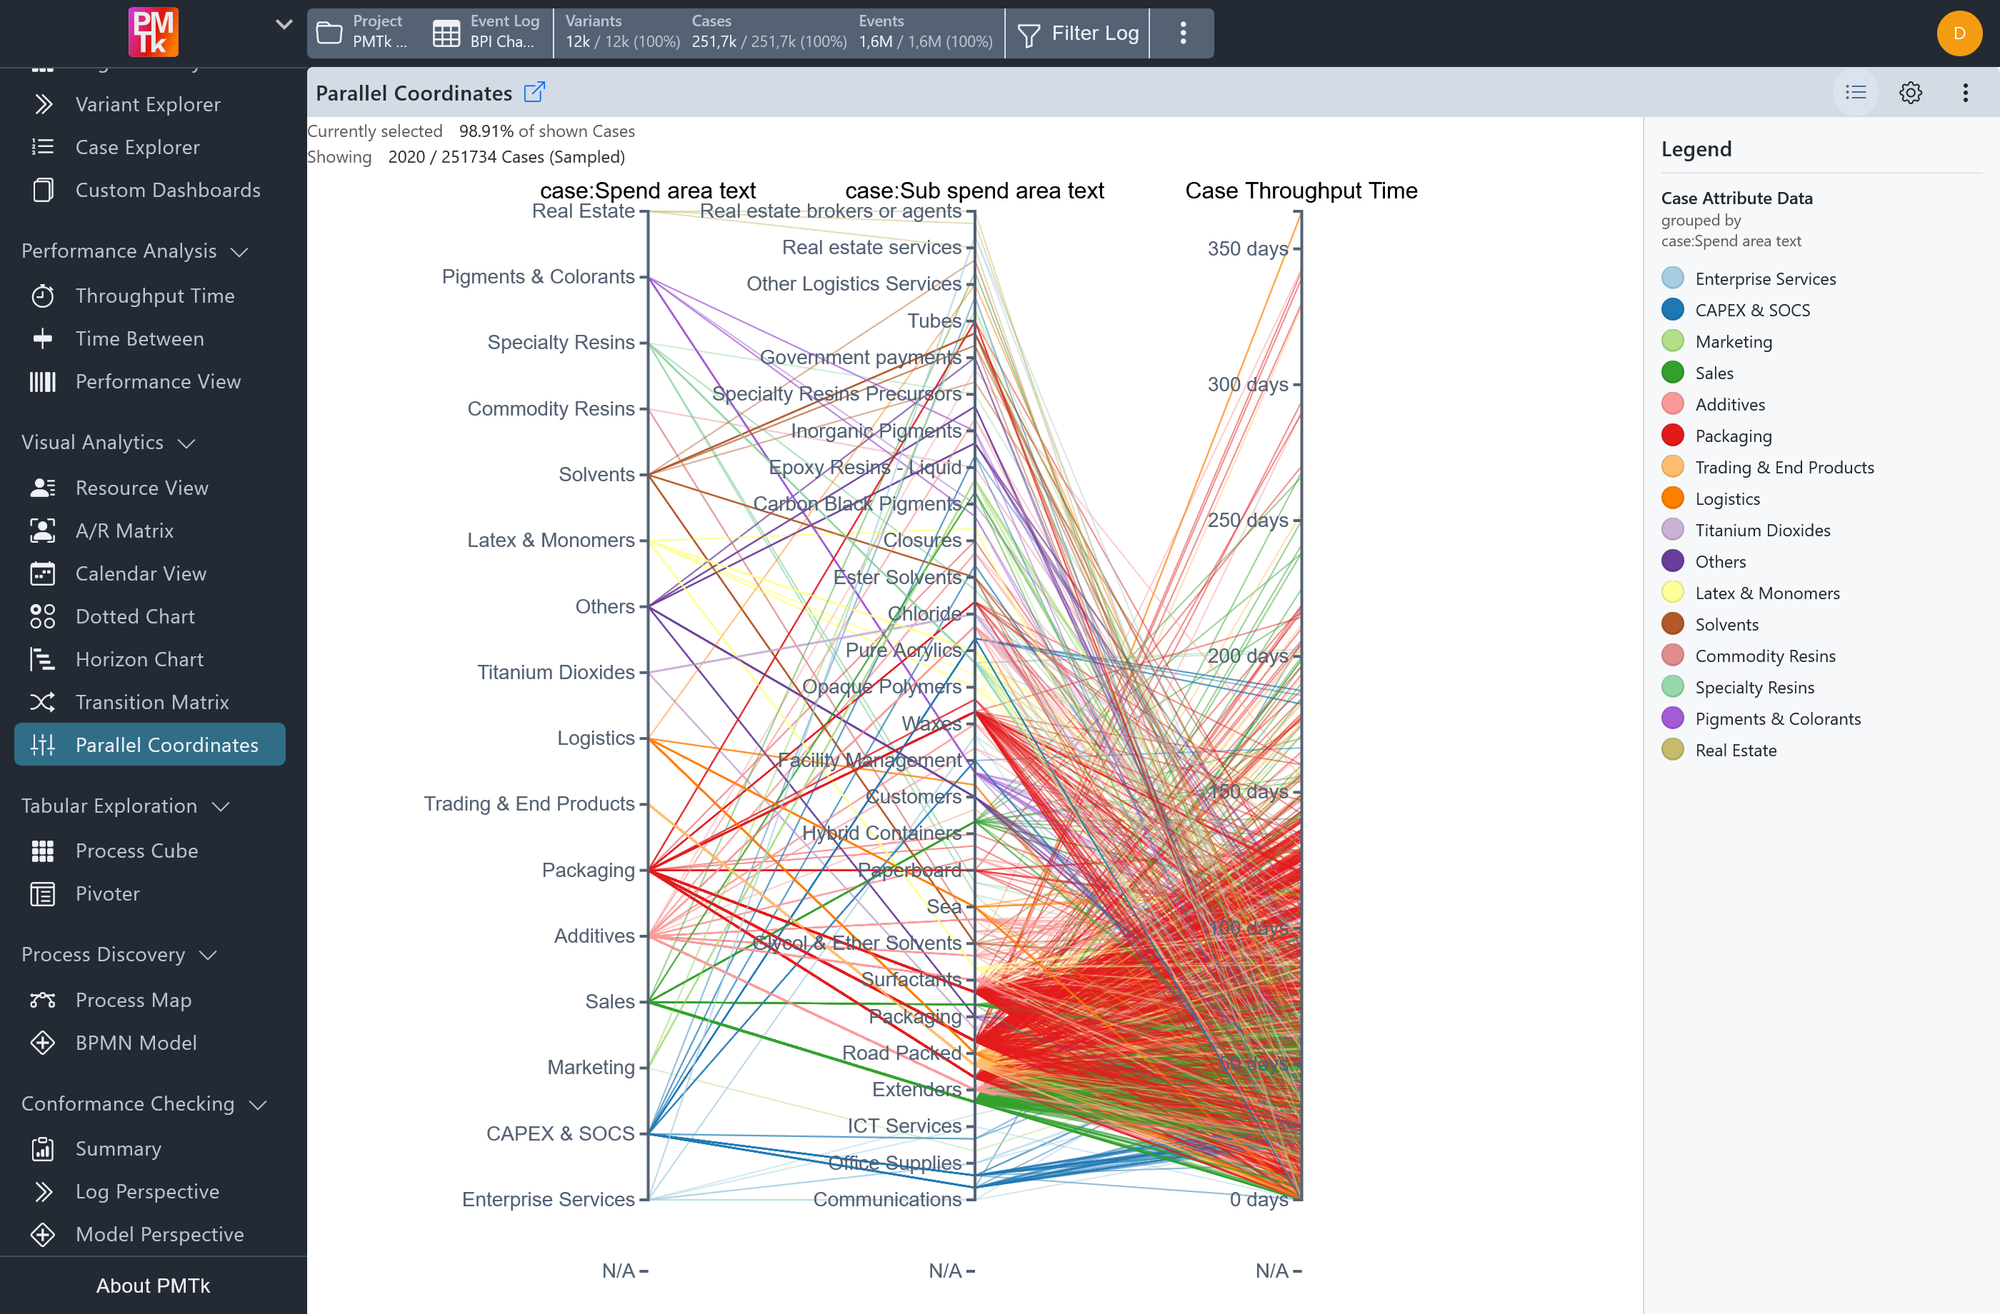
Screenshot shows the Parallel Coordinates view with the Focus Attribute set to Spend area text. All lines are colored according to the spend area value of their respective case, with the legend on the right mapping each color to its corresponding attribute value.
Parallel Coordinates Highlighting & Filtering

Screenshot shows the Parallel Coordinates view with an active axis range selection on all axes. Lines that do not pass through those selected ranges are greyed out, with 7.29% of shown cases remaining highlighted. A single highlighted case is rendered in green.
Axis Highlighting
Clicking and dragging on any axis marks a range of values on that axis. Lines passing through the marked range remain fully visible, while all others are greyed out. The percentage of currently selected cases is shown in the header above the chart. Multiple axes can have active ranges simultaneously, in which case only lines satisfying all ranges remain highlighted. An active range on an axis can be cleared by clicking on it, or all highlights can be cleared at once using the eraser icon in the toolbar.
Apply Filters
With one or more axis ranges marked, clicking Filter Selected Cases in the toolbar applies a separate filter per axis to the global event log. Depending on the data type, the filter type can be either a Text Attribute Filter, a Numeric Attribute Filter, or a Timeframe Filter.
