Process Overview Log Summary
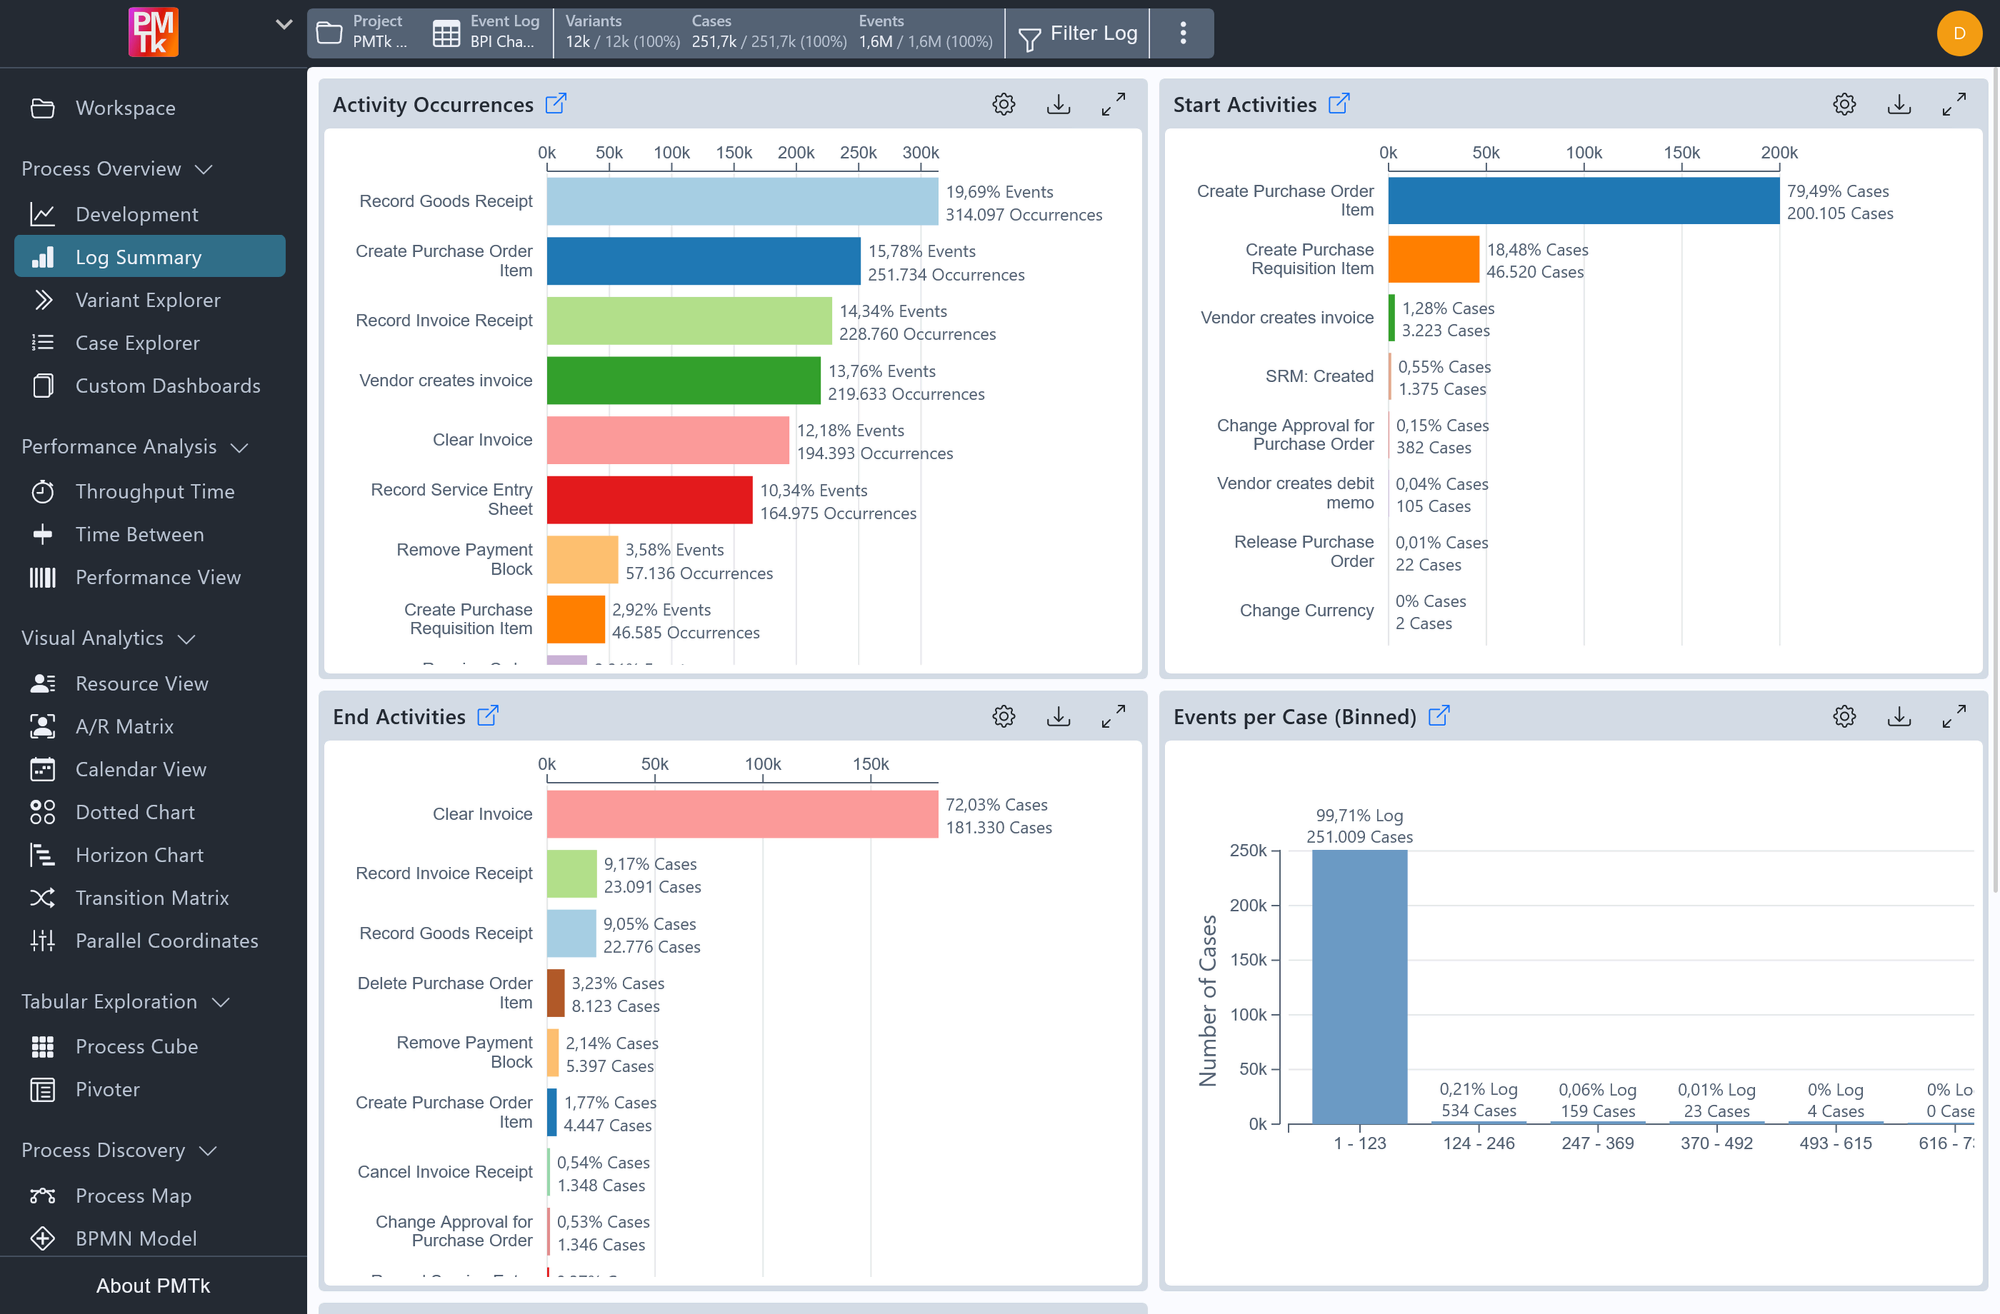
Screenshot shows the Log Summary dashboard, displaying four of the five charts: Activity Occurrences, Start Activities, End Activities, and Events Per Case (Binned). Each bar charts are color-coded by activity and annotated with case or event counts and percentages.
The Log Summary dashboard provides a statistical overview of the event log's structure through five complementary charts. Together they describe how activities are distributed across the log, which activities most commonly start or end a case, and how many events individual cases tend to contain.
Log Summary Charts
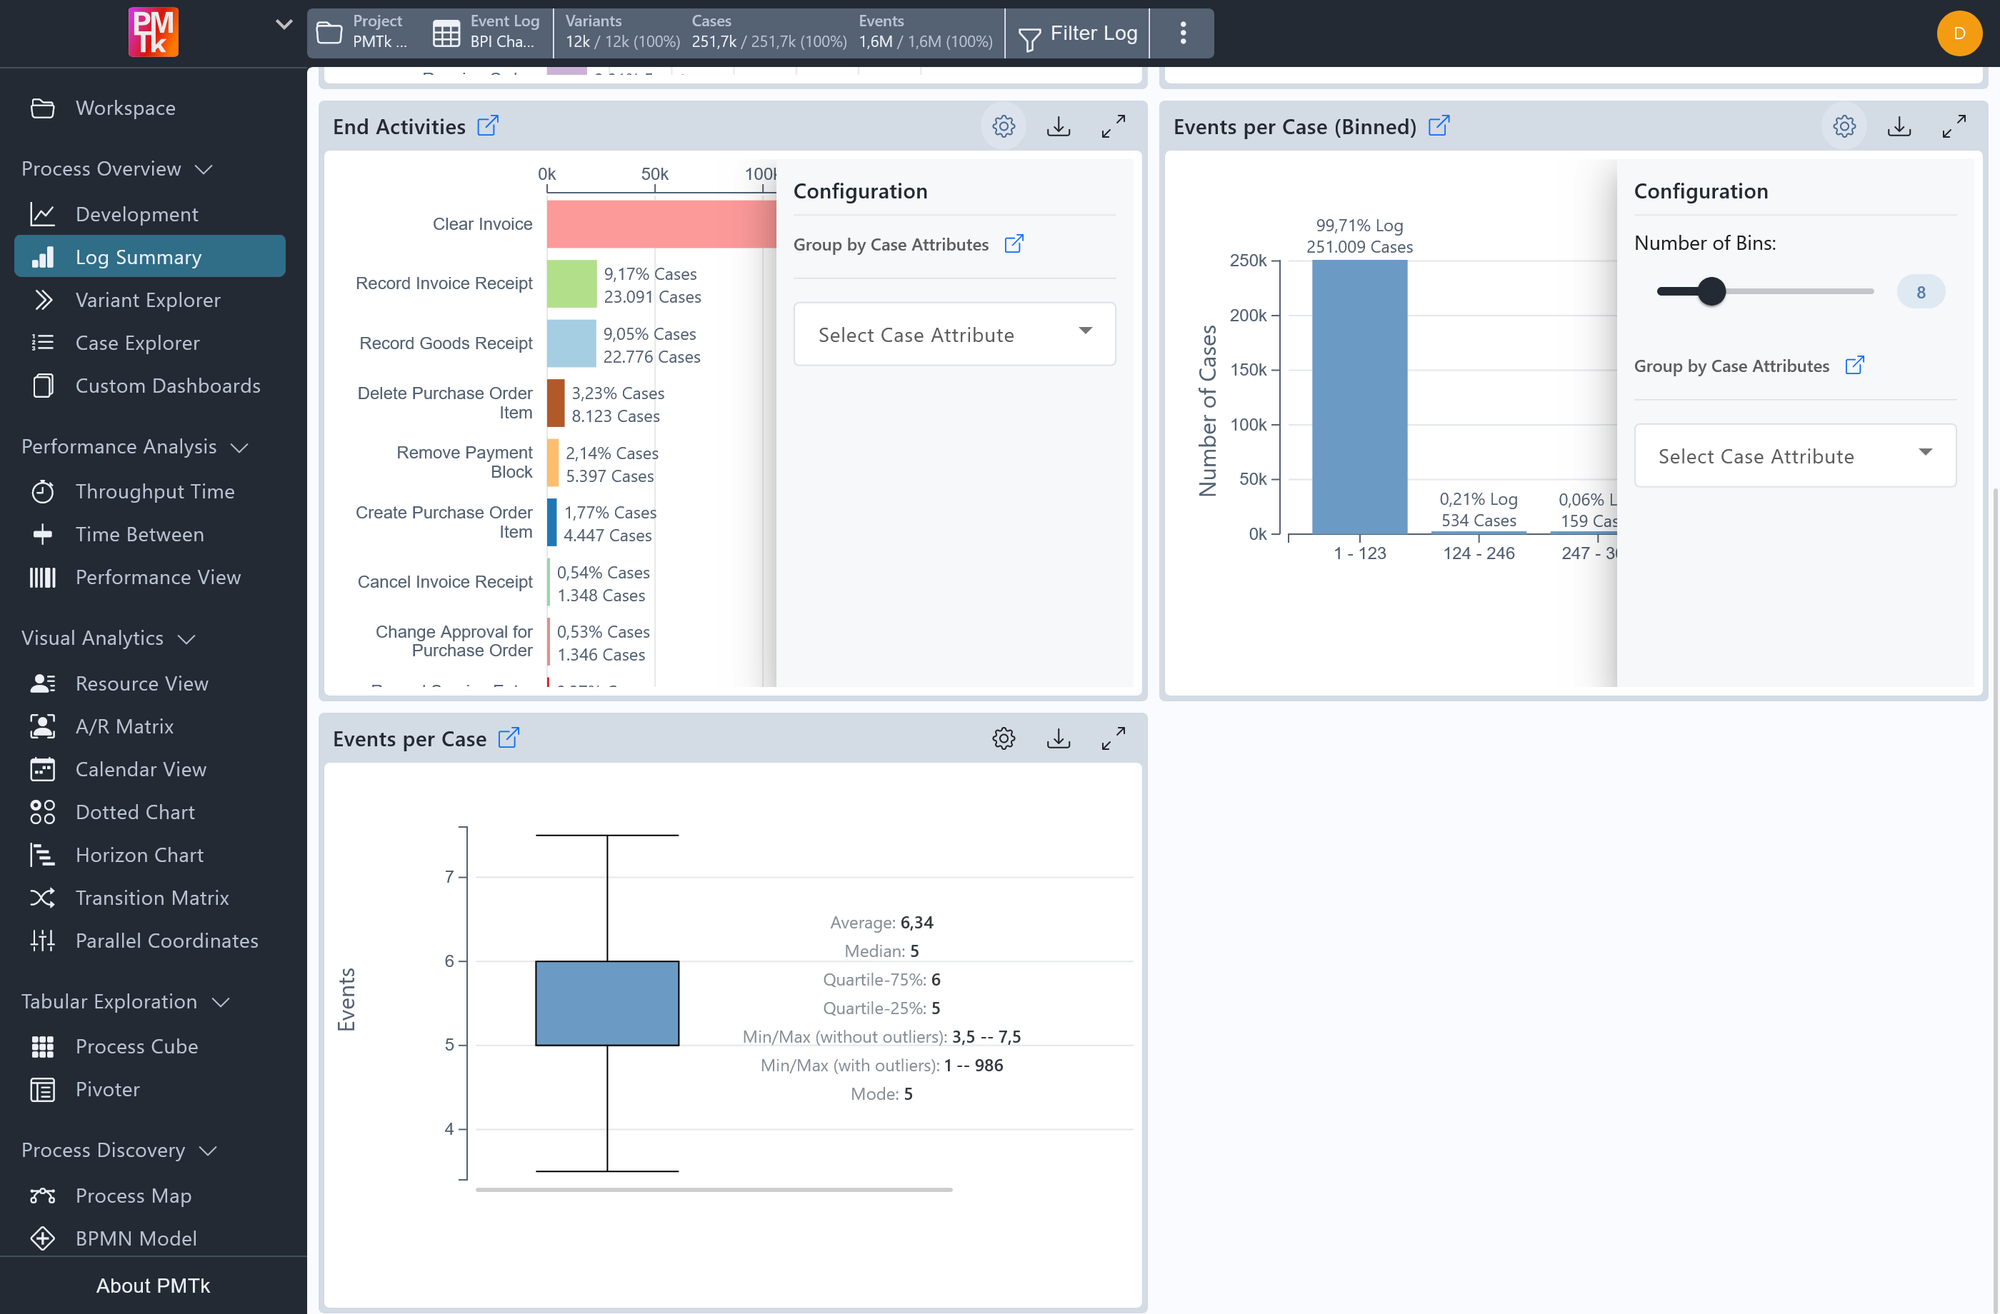
Screenshot shows the lower portion of the Log Summary dashboard. End Activities and Events Per Case (Binned) are shown with its configuration panel open. Below, the Events Per Case box plot displays the full statistical summary of event counts per case including average, median, quartiles, and min/max values both with and without outliers.
Activity Occurrences
A horizontal bar chart ranking all activities by how frequently they appear in the event log. Each bar is color-coded by activity and annotated with the activity's share of total events and its absolute occurrence count. By default, multiple occurrences of the same activity within a single case are each counted individually. This behavior can be changed in the chart's configuration (see below).
Start Activities
A horizontal bar chart showing which activities most commonly appear as the first event in a case, annotated with each activity's share of total cases and its absolute case count. This chart is useful for understanding how cases typically enter the process.
End Activities
A horizontal bar chart showing which activities most commonly appear as the last event in a case, annotated with each activity's share of total cases and its absolute case count. This chart is useful for understanding how and where cases typically conclude.
Events Per Case (Binned)
A histogram grouping cases into bins based on how many events they contain. Each bar shows the number of cases falling within a given event-count range, along with its share of the total log. This chart gives a quick sense of case complexity distribution and whether the log is dominated by short or long cases.
Events Per Case
A box plot summarizing the distribution of event counts per case. The plot displays the median, interquartile range (Q25-Q75), min/max values both with and without outliers, the average, and the mode. This provides a more statistically detailed complement to the binned histogram above.
Log Summary Toolbar
Each chart has its own set of controls accessible via the icon buttons in its top-right corner:
| Control | Description |
|---|---|
| Configuration | Toggles the chart's configuration panel. See below for details on available settings. |
| Legend | Toggle the legend that appears when a Group by Case Attributes setting is active. |
| Expand View | Expands the chart to fill the screen for a closer look. |
| Download | Exports the chart as an image or downloads the underlying plot data. |
Log Summary Configuration
Each chart has its own configuration panel accessible via . All charts share the Group by Case Attributes option. Additional chart-specific settings are:
| Chart | Setting | Description | Values |
|---|---|---|---|
| Activity Occurrences | Absolute Occurrences | Toggles whether every occurrence of an activity is counted individually, including repeated appearances within the same case. When disabled, each activity is counted at most once per case, giving a sense of how many cases each activity appears in rather than how many times it occurs overall. |
|
| Events Per Case (Binned) | Number of Bins | A slider that controls how many bins the event-count range is divided into, allowing you to adjust the granularity of the histogram. | 1 - 30 (default: 8) |
| Events Per Case | Show Outliers | Controls whether outlier data points are included in the box plot. |
|
Log Summary Filtering
All charts except the Events Per Case box plot support click-based filtering. Clicking on a bar in any of the supported charts opens a filter dialog. The filter options available depend on the chart:
Activity Occurrences supports both case-level and event-level filtering:
| Option | Effect |
|---|---|
| Filter cases containing | Retains only cases that include at least one occurrence of the selected activity. |
| Filter cases not containing | Removes all cases that include at least one occurrence of the selected activity. |
| Keep only specified events | Keeps only the individual events matching the selected activity, removing all others. |
| Remove specified events | Removes all individual events matching the selected activity, leaving the rest intact. |
Start Activities, End Activities, and Events Per Case (Binned) support case-level filtering only:
| Option | Effect |
|---|---|
| Filter cases containing | Retains only cases matching the selected bar's criteria. |
| Filter cases not containing | Removes all cases matching the selected bar's criteria. |
Depending on the chart, this applies either a Text Attributes Filter, Start Activity Filter, End Activity Filter, or a Case Size Filter to the event log globally, restricting all downstream analyses. The filters can be adjusted at any time through the filter controls in the top bar.
