Data Exploration Pivoter
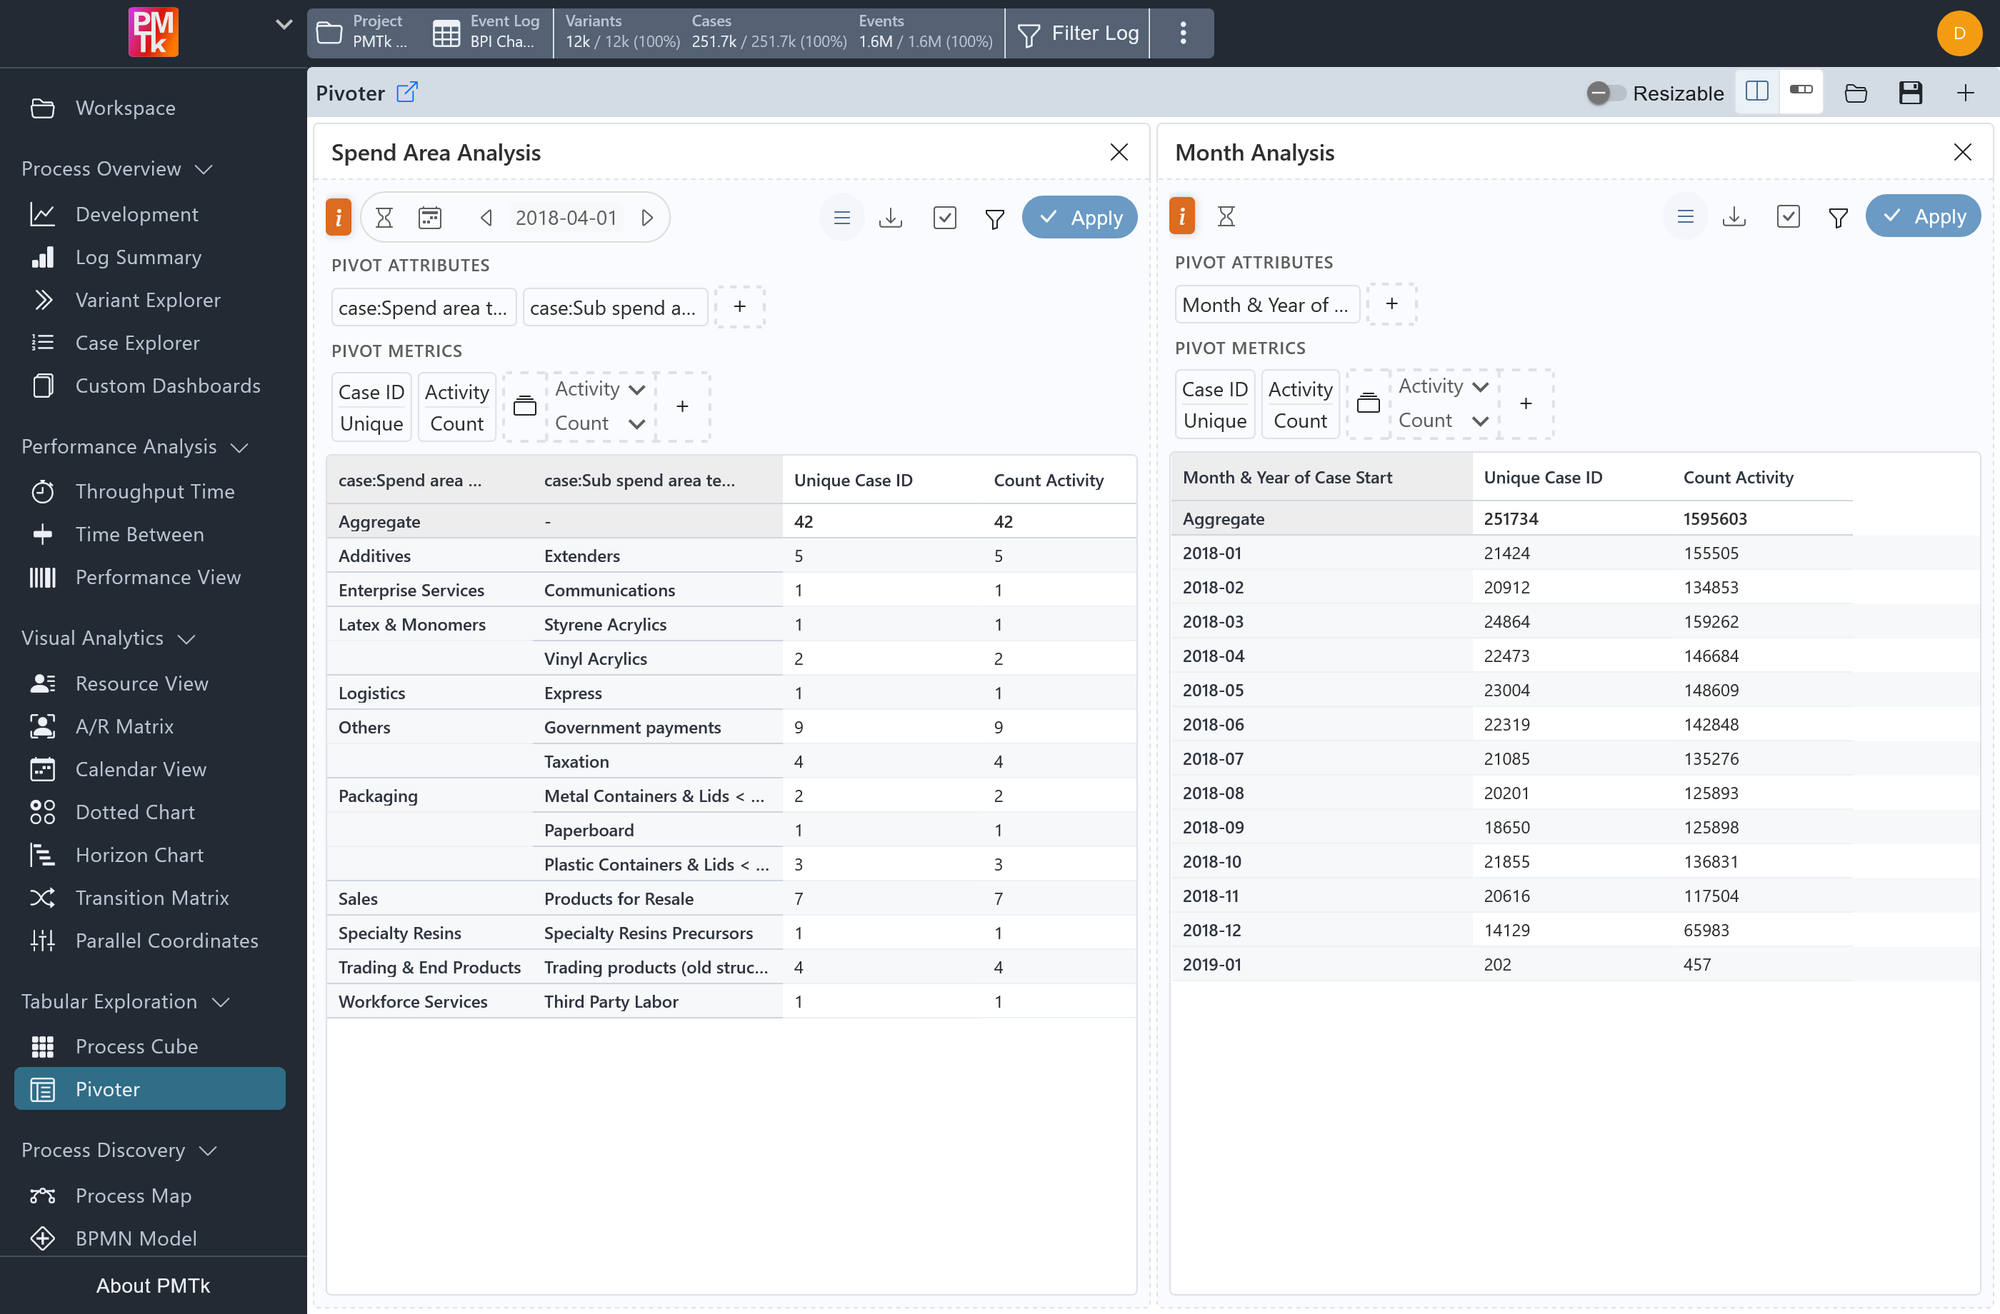
Screenshot shows two side-by-side Pivoter tables. Spend Area Analysis groups by case:Spend area text and case:Sub spend area text, computing Unique Case ID and Count Activity. Month Analysis groups by Month & Year of Case Start, showing Unique Case ID and Count Activity across calendar months.
The Pivoter lets you build custom pivot tables over the event log. You can open multiple tables side by side, each with its own grouping attributes (Pivot Attributes) and computed metrics (Pivot Metrics).
Unlike other views in PMTk, the Pivoter does not distinguish between case-level and event-level attributes, i.e., it treats the event log as a flat table of events. When a case-level attribute is selected as an aggregation column, a warning icon appears in the top-left corner of the table. In this situation, summing or averaging the attribute will count the same case value once per event, which may not reflect the intended metric. You can mitigate this by pre-processing the data via Filtering into an event log where each case has only one event before computing the metric.
Support for case-aware aggregation is planned for a future release.
Defaults and visibility options for this component (initial time mode, group sorting behavior, predefined metrics, and more) can be configured in Feature Management.
Pivoter Tables
Click in the top-right to add a new table. Click on the table's title bar to remove it. Click the table's title (e.g., Pivoter 1) to rename it.
Pivot Attributes
Pivot Attributes define the columns by which the table groups its rows. Only Text (String) attributes are supported. Add an attribute using the button in the Pivot Attributes section. The order of attributes determines the grouping hierarchy when Group Sorting is enabled.
In addition to the attributes in the event log and those created by PMTk, the following computed attributes are available exclusively in the Pivoter:
| Attribute | Description |
|---|---|
| Activity Day | The calendar day on which the event occurred. |
| Activity Week | The calendar week of the event. |
| Activity Month | The calendar month of the event. |
| Activity Year | The calendar year of the event. |
These are event-level attributes and differ from the case-level equivalents such as Month & Year of Case Start, which carries only one value per case.
Pivot Metrics
Pivot Metrics define the numeric columns computed for each group. Each metric combines an Aggregation Column and an Aggregation Function, with optional advanced settings (see Advanced Settings below).
A metric shown with a dashed outline in the Pivot Metrics section is only in a preview state. Click at the end of the row to confirm and lock it in.
| Aggregation Function | Description |
|---|---|
| Count | Number of events in the group. |
| Unique | Number of distinct values of the Aggregation Column within the group. |
| Min | Smallest value of the Aggregation Column within the group. |
| Max | Largest value of the Aggregation Column within the group. |
| Sum | Sum of all values of the Aggregation Column within the group. Disabled for Text (String) attributes. |
| Mean | Average of all values of the Aggregation Column within the group. Disabled for Text (String) attributes. |
Table Toolbar
Each table has its own toolbar directly below its title.
Timeframe
The timeframe selector on the left side of the toolbar controls the date range considered in the table. It consists of a Time Mode selector and a date navigator:
| Time Mode | Description |
|---|---|
| Daily | Displays data for a single day. |
| Weekly | Displays data for a calendar week. |
| Monthly | Displays data for a calendar month. |
| Yearly | Displays data for a calendar year. |
| Total | Displays data across the entire event log, ignoring the date selection. |
| Last n Days | Displays data for the last n days, where n is a user-defined number also set in the Time Mode selector. |
Use the calendar icon to pick a specific date, or the arrow buttons to step to the previous or next period.
Other Table Toolbar Controls
| Control | Description |
|---|---|
| Toggle pivot settings | Hides or shows the Pivot Attributes and Pivot Metrics configuration rows above the table. |
| Download table | Exports the current table data. |
| Group Sorting | Toggles hierarchical group sorting (see below). |
| Local Filters | Opens the same filter dialog as Filter Log, including a full Filter Chain, but scoped exclusively to this table. Filters applied here do not affect other tables or views. |
| Apply | Applies any pending configuration changes to the table. Changes are not reflected until Apply is clicked. |
Group Sorting
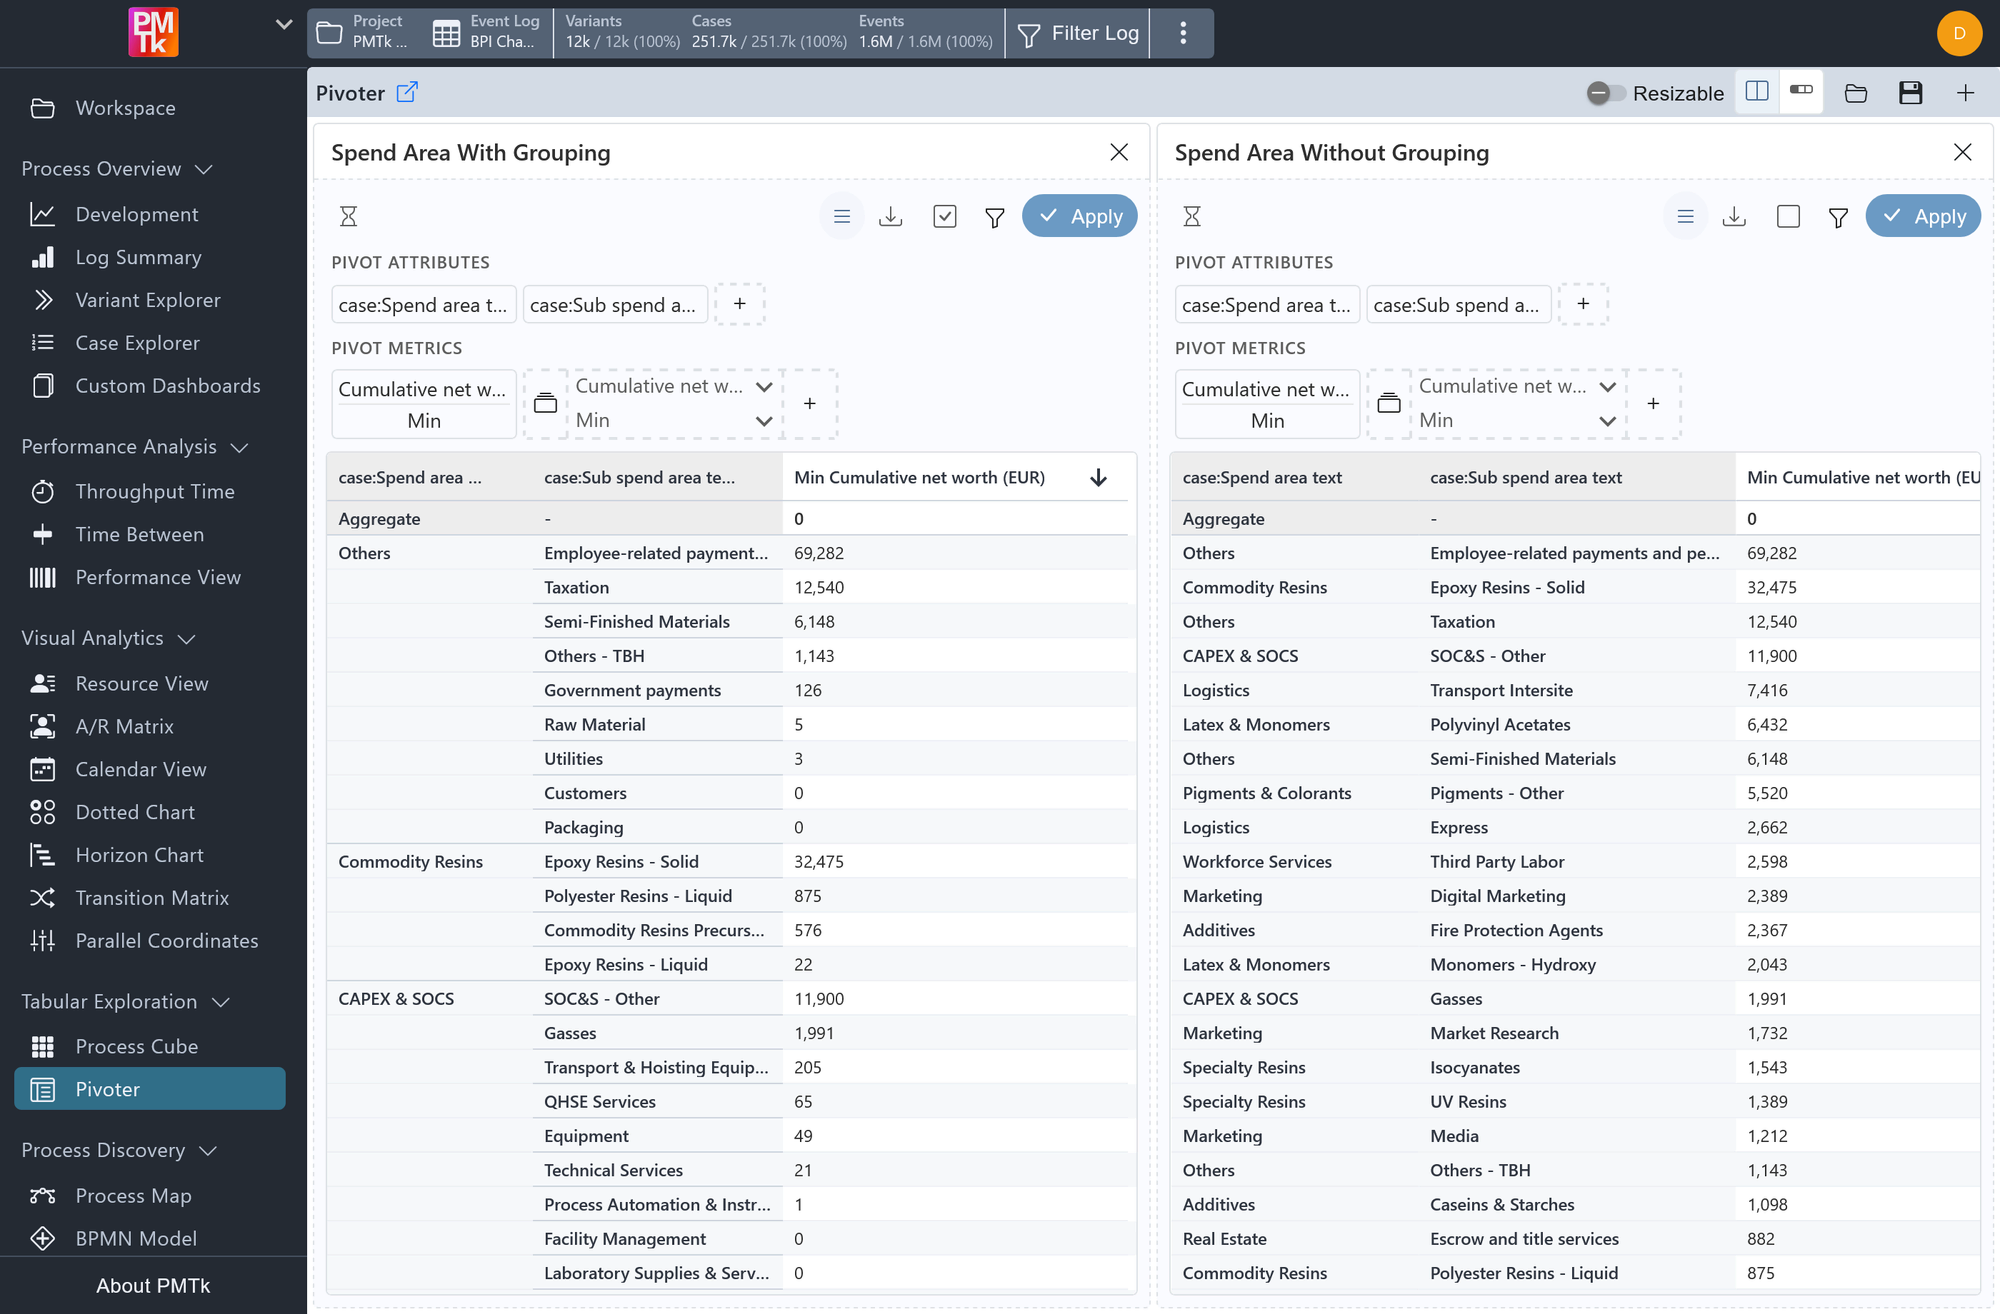
Screenshot shows two tables with different sorting behavior. Spend Area With Grouping (left) has Group Sorting enabled: rows with the same first Pivot Attribute value (e.g., Others) remain grouped together and are only sorted among themselves. Spend Area Without Grouping (right) has Group Sorting disabled: all rows are sorted independently.
When Group Sorting is enabled, rows are grouped hierarchically by the order of the Pivot Attributes. User-applied column sorting reorders the groups themselves but never breaks a group apart (i.e., members of the same group always stay together).
When Group Sorting is disabled, all rows are sorted independently without any hierarchical structure, as one would expect from a flat table sort.
Global Toolbar
The toolbar at the top right of the Pivoter view applies to all tables.
| Control | Description |
|---|---|
| Resizable | When disabled, all tables share the available horizontal space equally. When enabled, each table can be resized individually; the container becomes horizontally scrollable to accommodate wider layouts. |
| Split table view | Displays all tables side by side in a single scrollable row. |
| Tab table view | Displays each table as a tab, giving it the full horizontal width of the view. |
| Load Configuration | Opens a list of saved configurations available in the current project, with global configurations listed before your private ones. |
| Save Configuration | Saves the current setup (all tables, their attributes, metrics, and settings). Give it a name and choose Private (visible only to you) or Global (visible to all users; requires edit permissions). Configurations are stored as project-scoped Pivoter settings and can be overwritten or deleted from this menu when you have the required permissions. |
| Add new table | Adds a new empty Pivoter table to the view. |
Advanced Pivot Metric Settings
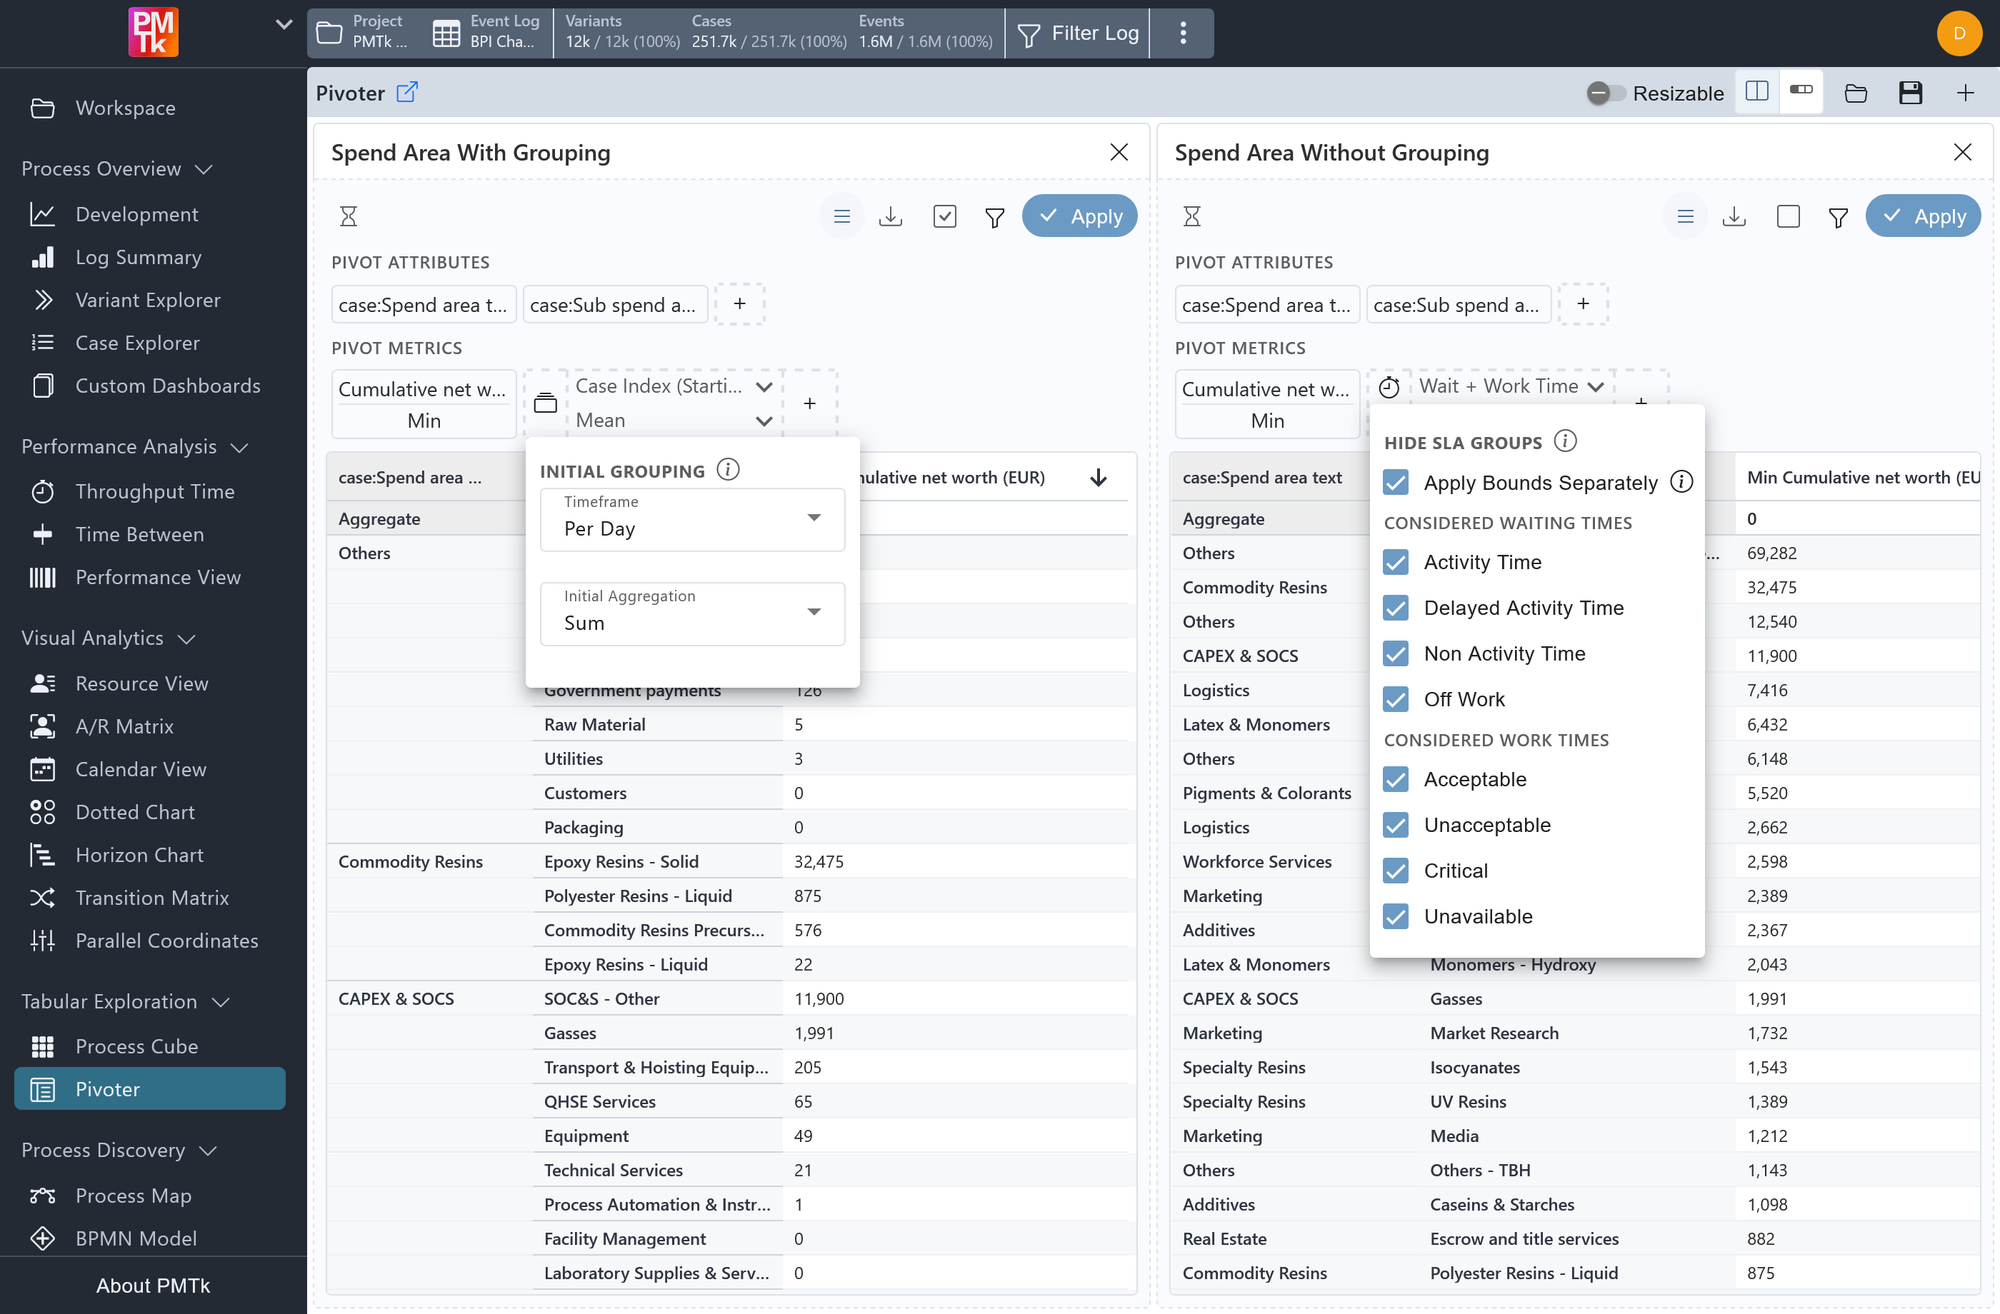
Screenshot shows two tables with advanced metric settings open. Spend Area With Grouping (left) shows the Initial Grouping selector. Spend Area Without Grouping (right) shows the Hide SLA Groups panel for a Wait + Work Time metric, with its Considered Waiting Times and Considered Work Times sections both listed.
Some metrics have additional settings that appear to the left of the Aggregation Column and Function selectors when applicable.
Initial Grouping
Always available. Adds an intermediate aggregation step before the main aggregation function is applied:
- Events are first grouped by the selected time unit (currently Per Day).
- The initial aggregation function is applied within each of those groups.
- The main aggregation function is then applied across the resulting values.
Example: Selecting Per Day with initial function Sum and main aggregation function Mean first sums the metric for each day, then averages those daily totals, yielding a Mean [Metric] Per Day result. Without Initial Grouping, Mean alone would average all individual event values directly, resulting in a very different metric.
Hide SLA Groups
Only available when an SLA-based attribute (Wait Time, Work Time, or Wait + Work Time) is selected as the Aggregation Column. Displays the configured SLA Groups (as defined in the SLA Editor), under a Considered Waiting Times heading for Wait Time Groups or a Considered Work Times heading for Work Time Groups. A Wait Time or Work Time metric shows only the relevant heading; a Wait + Work Time metric shows both.
SLA Groups partition durations into named tiers, for example, Wait Time Groups Activity Time, Delayed Activity Time, and Non Activity Time, with a fallthrough group Off Work (anything longer, capturing overnight or weekend gaps).
Without any filtering, those multi-hour off-work periods would heavily skew the metric upwards, even though they do not represent genuine process delays. Unchecking a group removes events whose duration falls into it from the metric entirely, so you can focus the calculation on the durations that are actually relevant to your analysis.
For Wait + Work Time metrics, an additional toggle is available:
| Setting | Description |
|---|---|
| Apply bounds separately (enabled; default) | Wait Time and Work Time are evaluated independently. If an event's Wait Time falls into a hidden group but its Work Time does not, the Work Time is still counted, and vice versa. |
| Apply bounds separately (disabled) | If either the Wait Time or the Work Time of an event falls into a hidden group, the entire event is excluded from the metric. |
