Settings Feature Management

Screenshot shows the Feature Management dialog on the Components page. The left sidebar lists the available pages. The right panel shows the Initialization, Date & Time, Duration Display, and Interface settings at the top, followed by the Visible Components toggles for each dashboard and view.
Feature Management is a Beta Feature available to Owner role users. It allows you to customize the PMTk interface for your instance, controlling which components are visible, what defaults are applied, and which filter and component-specific settings are available to users. As a Beta Feature, not all parts of PMTk are fully supported yet and occasional inconsistencies may occur.
In older versions of PMTk this feature was called View Settings or View Management.
Feature Management is divided into several pages, navigated via the left sidebar. Changes are applied individually per page by clicking Save. Click the reset icon next to Save to revert to default settings.
View As
Admin users have an additional View As option in the user menu. It lets you switch between two modes:
- View User: PMTk is displayed exactly as configured by Feature Management, resulting in the same experience regular users see.
- Admin User: The Feature Management configuration is suspended for your session, giving you access to all components and settings regardless of what has been hidden.
This makes it straightforward to verify how the configured view looks to users without needing a separate account.
Components
Initialization
The following general settings control the startup behavior and default preferences of PMTk:
| Setting | Description |
|---|---|
| Initial Event Log | The event log that is automatically loaded when a user opens PMTk. When set, users land directly in the configured Initial Component instead of the Workspace. |
| Initial Component | The component PMTk opens to after loading the Initial Event Log. Requires an Initial Event Log to be set. Defaults to Workspace when not configured. |
| Default View Projects | Projects that are automatically visible to every new user without requiring explicit view permissions. Intended to avoid the overhead of manually granting access to shared reference projects. |
Date & Time
| Setting | Description |
|---|---|
| Week Mode | Defines whether weeks start on Monday or Sunday. Affects weekly groupings in the Pivoter and Resource View. |
| Default Timestamp Format | Sets the timestamp format applied by default across all views (see Appearance for the available formats). When configured here, non-admin users cannot change it themselves. |
| Default Timezone | Sets the timezone applied by default across all views (see Appearance for the available options). When configured here, non-admin users cannot change it themselves. |
Duration Display
Sets the instance-wide default for how durations are displayed, using the same Units, Maximum Number of Units, and Separator options available on the Appearance page. When configured here, non-admin users cannot change it themselves.
| Setting | Description |
|---|---|
| Units | Selects which duration units (Years, Months, Weeks, Days, Hours, Minutes, Seconds) are available by default. |
| Max. Units | Sets the default maximum number of units shown (1, 2, 3, or All). |
| Separator | Sets the default character(s) shown between consecutive units. |
Interface
| Setting | Description |
|---|---|
| Switch Default Statusbar Collapsed State | Controls the default collapsed or expanded state of the status bar, i.e., the bar at the top of the screen containing the event log control panel and the profile icon. |
| Disable Documentation Links | When enabled, hides the documentation link shown next to the title of most components (e.g. "Process Cube "), which otherwise opens this documentation to the corresponding page. |
Visible Components
Below the initialization settings, each section of the navigation sidebar (Dashboards, Visual Analytics, Data Exploration, etc.) is listed with individual toggle switches. Disabling a toggle hides that component from the sidebar for all non-admin users. Entire sections can be hidden at once by disabling the section-level toggle.
Filter
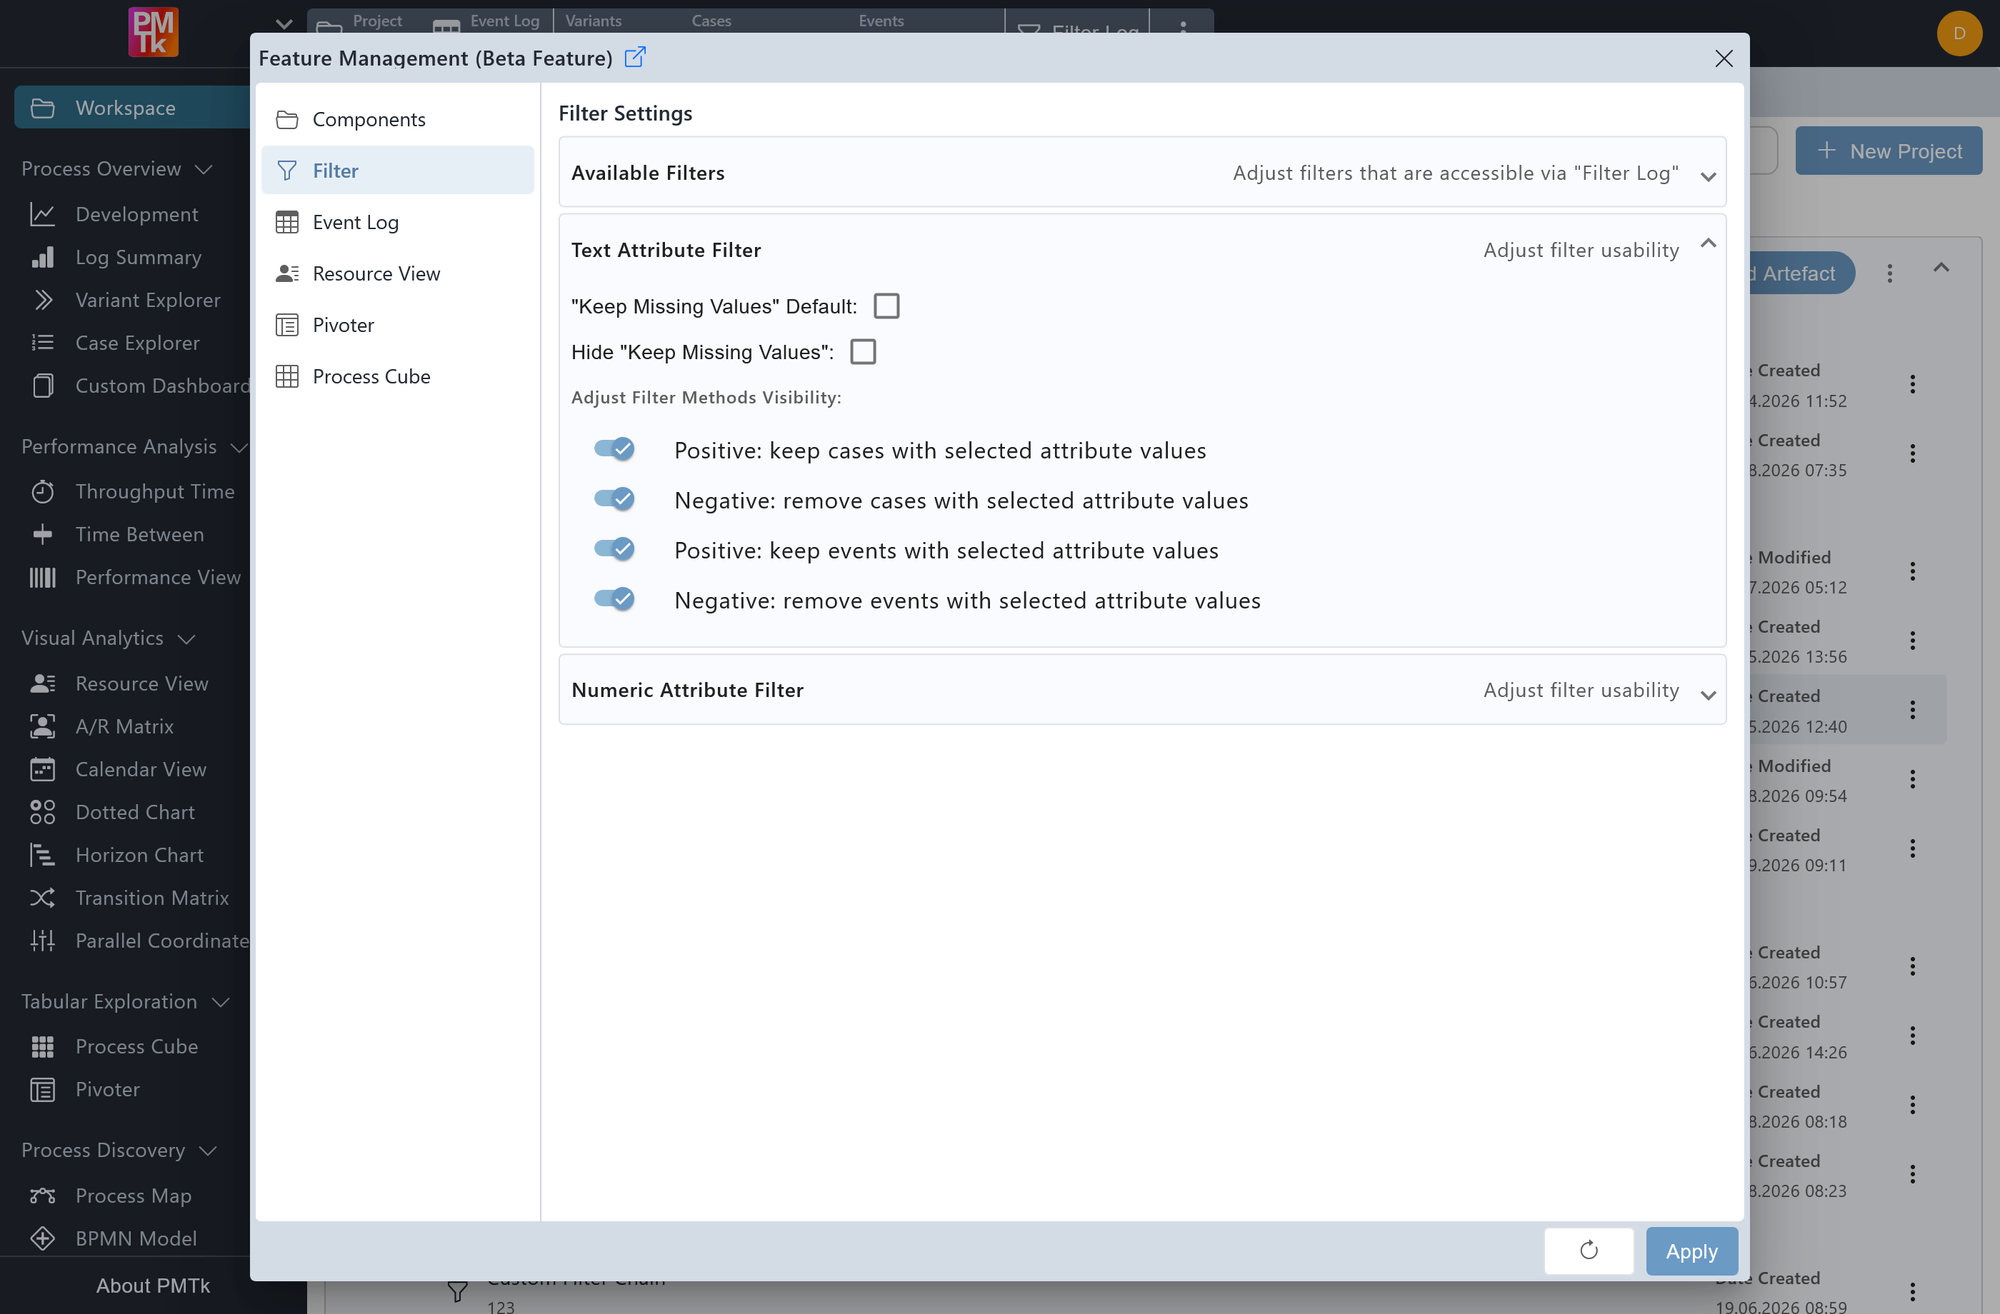
Screenshot shows the Filter Settings page. The Available Filters section controls which filters appear in Filter Log. Below it, filter-specific settings are listed per filter type.
Available Filters
The Available Filters section works like Visible Components: each filter that can appear in Filter Log (and its local variants) is listed with a toggle. Disabling a toggle removes that filter type from the selection for all non-admin users.
Filter-Specific Settings
Below the available filters list, individual filter types expose additional configuration options. Each filter type can be expanded to reveal its settings. Currently supported filter types are Text Attribute Filter and Numeric Attribute Filter, both offering the same set of options:
| Setting | Description |
|---|---|
| "Keep missing values" default | Sets the default checked state of the Keep missing values option when a user opens the filter. |
| Hide "Keep missing values" | When enabled, the Keep missing values checkbox is hidden from non-admin users entirely. The configured default value is still applied silently. |
| Adjust Filter Methods Visibility | Individual filter methods can be shown or hidden using their own toggle switches. Hiding a method removes it from the filter dialog for non-admin users. |
Event Log
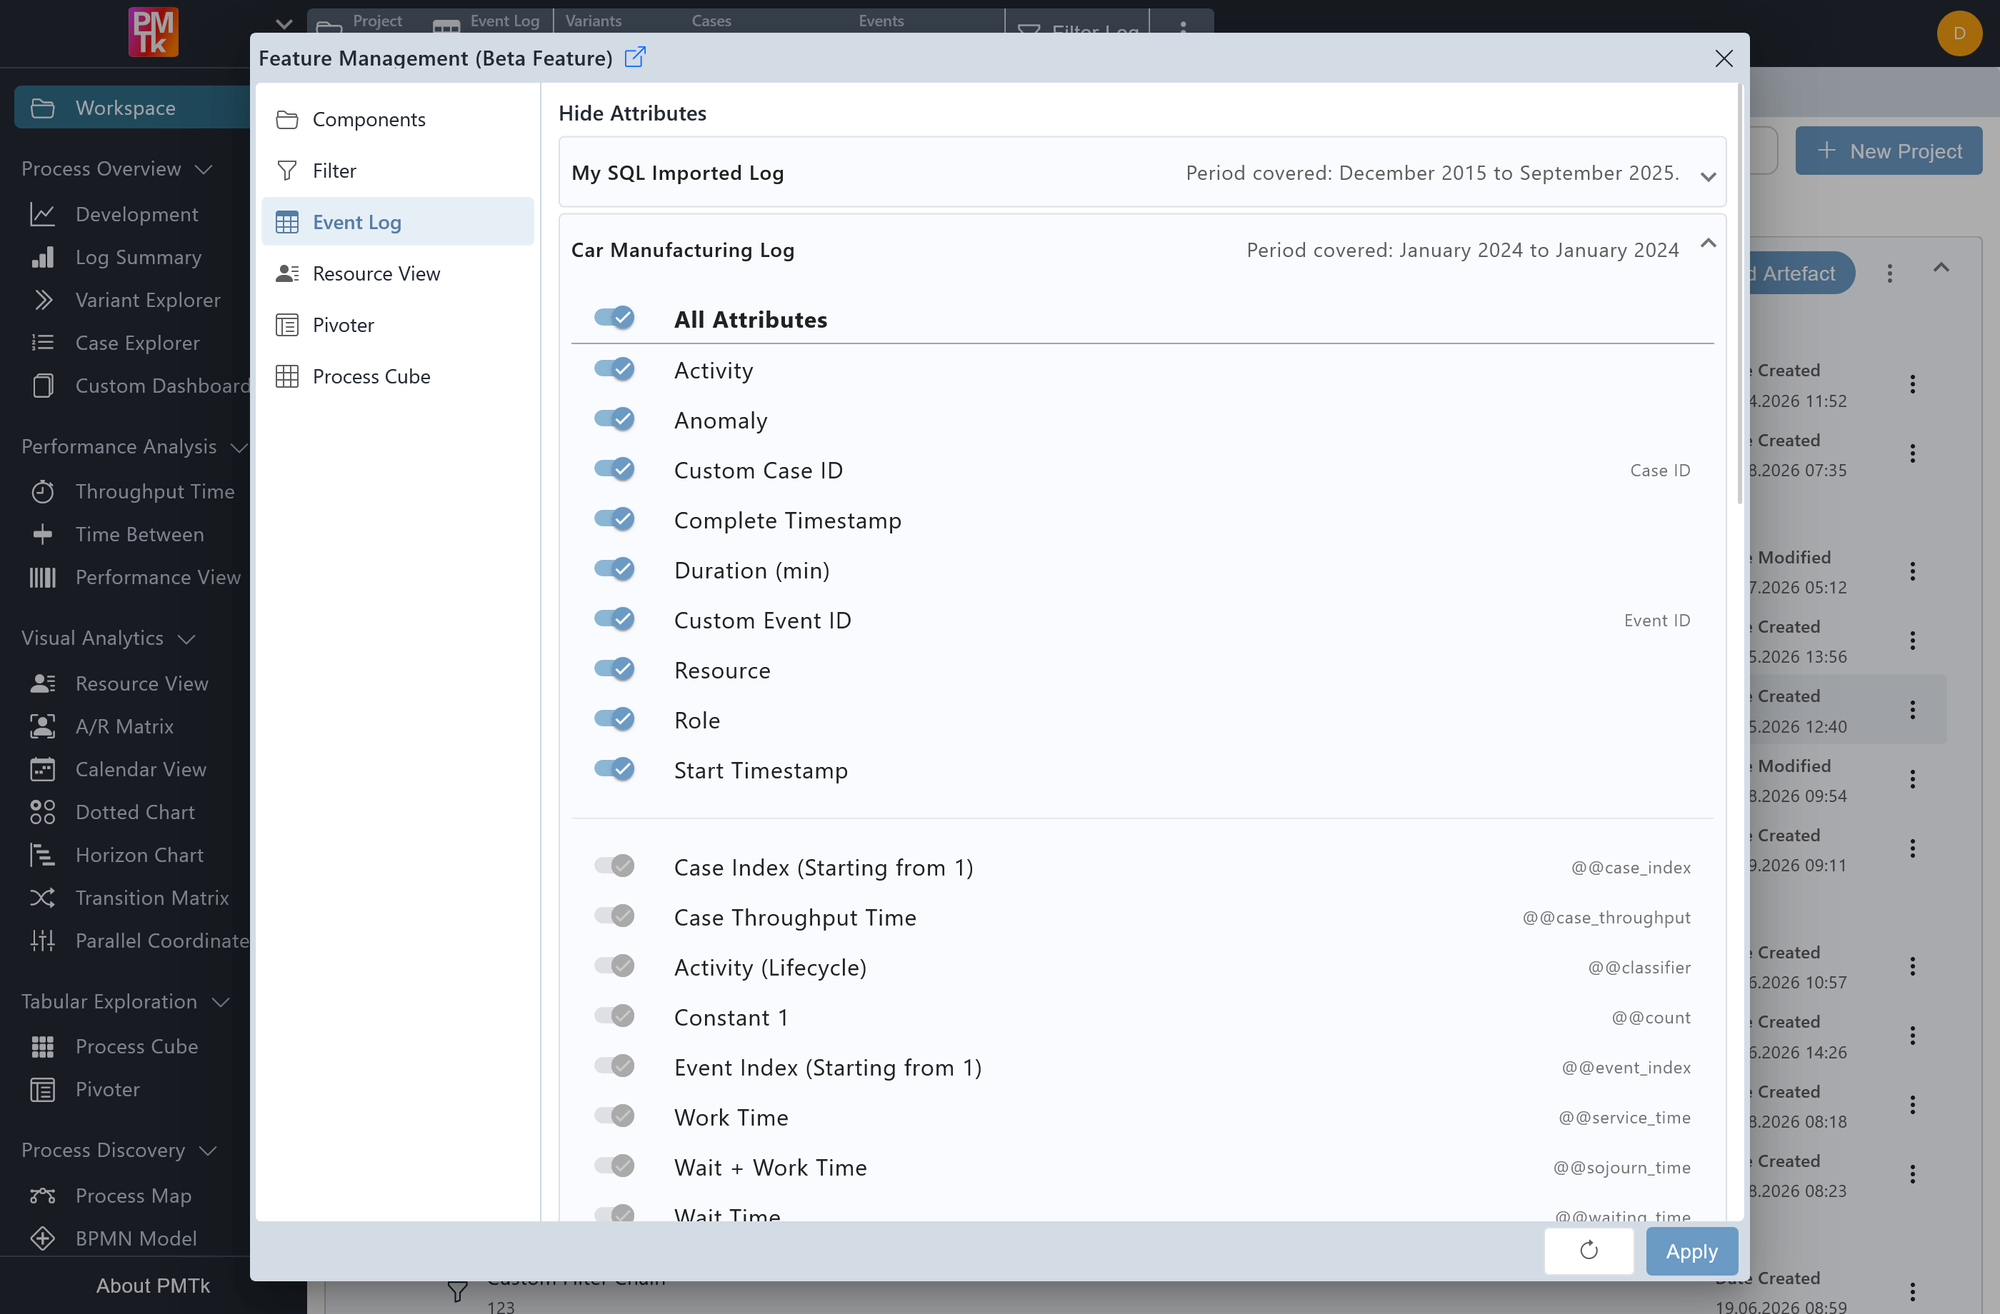
Screenshot shows the Event Log page with the Car Manufacturing Log expanded. All attributes are listed with their toggles and names. PMTk-specific attributes such as Case Index and Case Throughput Time are shown with their internal identifiers on the right and cannot be hidden.
The Event Log page lists all event log artefacts available in the Workspace. Expanding an event log tile loads the log and reveals its attribute list (depending on the log's size this may take a few seconds).
Two operations are available per attribute:
| Operation | Description |
|---|---|
| Hide / Show | Toggles the attribute's visibility across PMTk (for example in attribute selection dropdowns, filter dialogs, Pivot Attributes, and similar controls). PMTk-specific attributes (such as Case ID, Event ID, Case Throughput Time, etc.) cannot be hidden, but they can still be renamed. |
| Rename | Hover over an attribute name to reveal an edit button and change its display name. The renamed label is applied everywhere in PMTk where the attribute appears. The underlying data column is not affected. |
Resource View
This page configures the default behavior and available controls of the Resource View.
| Setting | Description |
|---|---|
| Initial Time Mode | The time mode the Resource View starts with when first opened (Daily, Weekly, Monthly, Yearly, or Total). |
| Hide "Change Time Mode" | When enabled, the time mode selector is hidden from non-admin users. The configured Initial Time Mode is still applied. |
| Default "Show Execution Markers" | Sets the default state of the Show Execution Markers toggle in the Resource View configuration. Execution Markers are the thin vertical lines overlaid on the Timeline Chart bars that mark the precise moment each activity was completed. |
| Hide "Show Execution Markers" | When enabled, the Show Execution Markers toggle is hidden from non-admin users in the configuration panel. The configured default is still applied. |
| Default "Show Indicators" | Sets the default state of the Show Indicators toggle in the Resource View configuration. Indicators are the SLA Group icons shown next to Wait Time and Work Time labels in the Waterfall Chart. |
| Hide "Show Indicators" | When enabled, the Show Indicators toggle is hidden from non-admin users in the configuration panel. The configured default is still applied. |
| Allow group changes | When enabled, users can edit SLA Groups directly from the Resource View configuration panel via the SLA Editor. When disabled, the SLA Editor in the Resource View is read-only and serves only as a legend, displaying the currently configured groups without allowing modifications. |
Pivoter
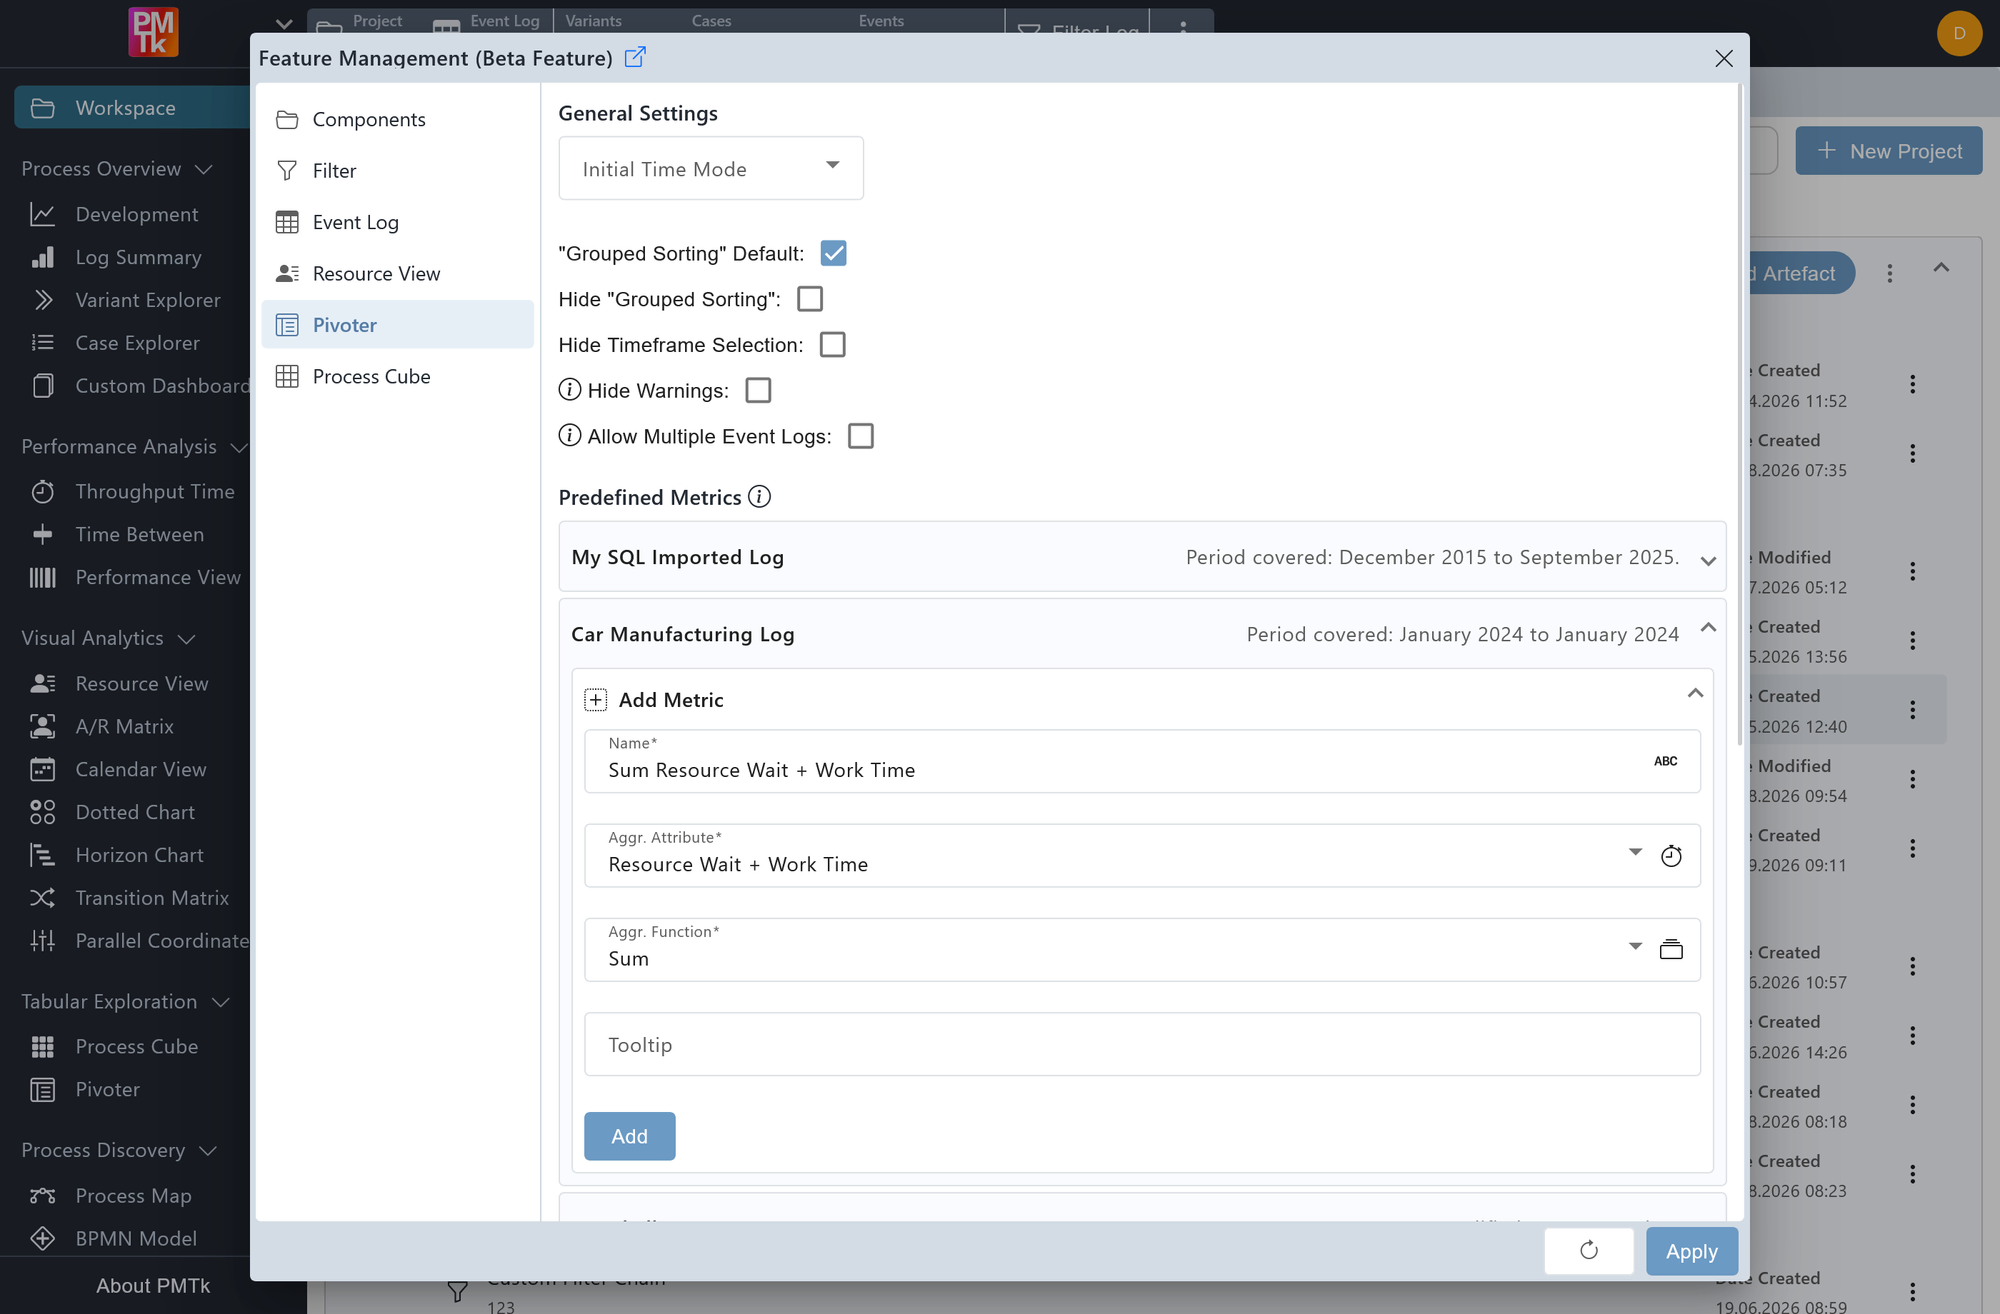
Screenshot shows the Pivoter settings page. The General Settings section is at the top, followed by the Predefined Metrics section listing available event logs. The Car Manufacturing Log is expanded and shows an existing metric (Average Wait Time per Day) alongside the Add Metric form.
This page configures the default behavior and available controls of the Pivoter.
General Settings
| Setting | Description |
|---|---|
| Initial Time Mode | The time mode each Pivoter table starts with when the view is first opened. Defaults to Total when not configured. See Timeframe for the available modes. |
| "Grouped sorting" default | Sets the default state of the Group Sorting toggle for each new table. |
| Hide "Grouped sorting" | When enabled, the Group Sorting toggle is hidden from non-admin users. The configured default is still applied. |
| Hide Timeframe selection | When enabled, the timeframe selector in each table toolbar is hidden from non-admin users. |
| Hide Warnings | When enabled, the warning icon that appears when a case-level attribute is used as an aggregation column is hidden from non-admin users. See Pivoter for details on when this warning appears. |
| Allow multiple event logs | When enabled, each Pivoter table can be based on a different event log. When adding a new table, users are asked which event log it should use. Enabling this can be heavy on performance when multiple large logs are loaded simultaneously. |
Predefined Metrics
Predefined Metrics let you define a fixed set of metrics for a specific event log. Once at least one predefined metric is configured for an event log, the Pivoter replaces the metric construction interface with a simple dropdown that lets users choose from those predefined metrics. This is useful when users should work with a curated set of metrics rather than building their own.
Expanding an event log tile loads the log to read its available attributes (this may take a few seconds for large logs). Click Add Metric to open the metric form:
| Field | Description |
|---|---|
| Name* | Display name for the metric. Button in the field auto-generates a name based on the selected attribute and function. |
| Aggr. Attribute* | The attribute to aggregate. If an SLA-based attribute (Wait Time, Work Time, or Wait + Work Time) is selected, an additional button opens the Hide SLA Groups configuration for this metric. |
| Aggr. Function* | The aggregation function to apply (Count, Unique, Min, Max, Sum, Mean). An additional button opens the Initial Grouping configuration for this metric. |
| Tooltip | Optional description shown to users when they hover over the metric in the Pivoter. |
Click Add to save the metric. Existing metrics can be edited via or removed via next to each metric entry.
Process Cube
This page configures the default behavior of the Process Cube's Multiple Attributes toggle.
| Setting | Description |
|---|---|
| Enable Multiple Attributes per Axis by Default | Sets the default state of the Multiple Attributes toggle. Unchecked by default, restricting the X and Y Columns to a single attribute each until a user enables it. |
| Hide the Toggle from Users (Enforce the Default Above) | Unchecked by default. When enabled, the Multiple Attributes toggle is hidden from non-admin users, who are then locked to whichever state is configured above. |
